Chance of Success
Stress-test the same plan two ways — thousands of simulated market futures and every real historical window since 1871 — using the same tax-aware engine, so the numbers line up. See how often the plan holds up, and what it takes to push the odds higher.
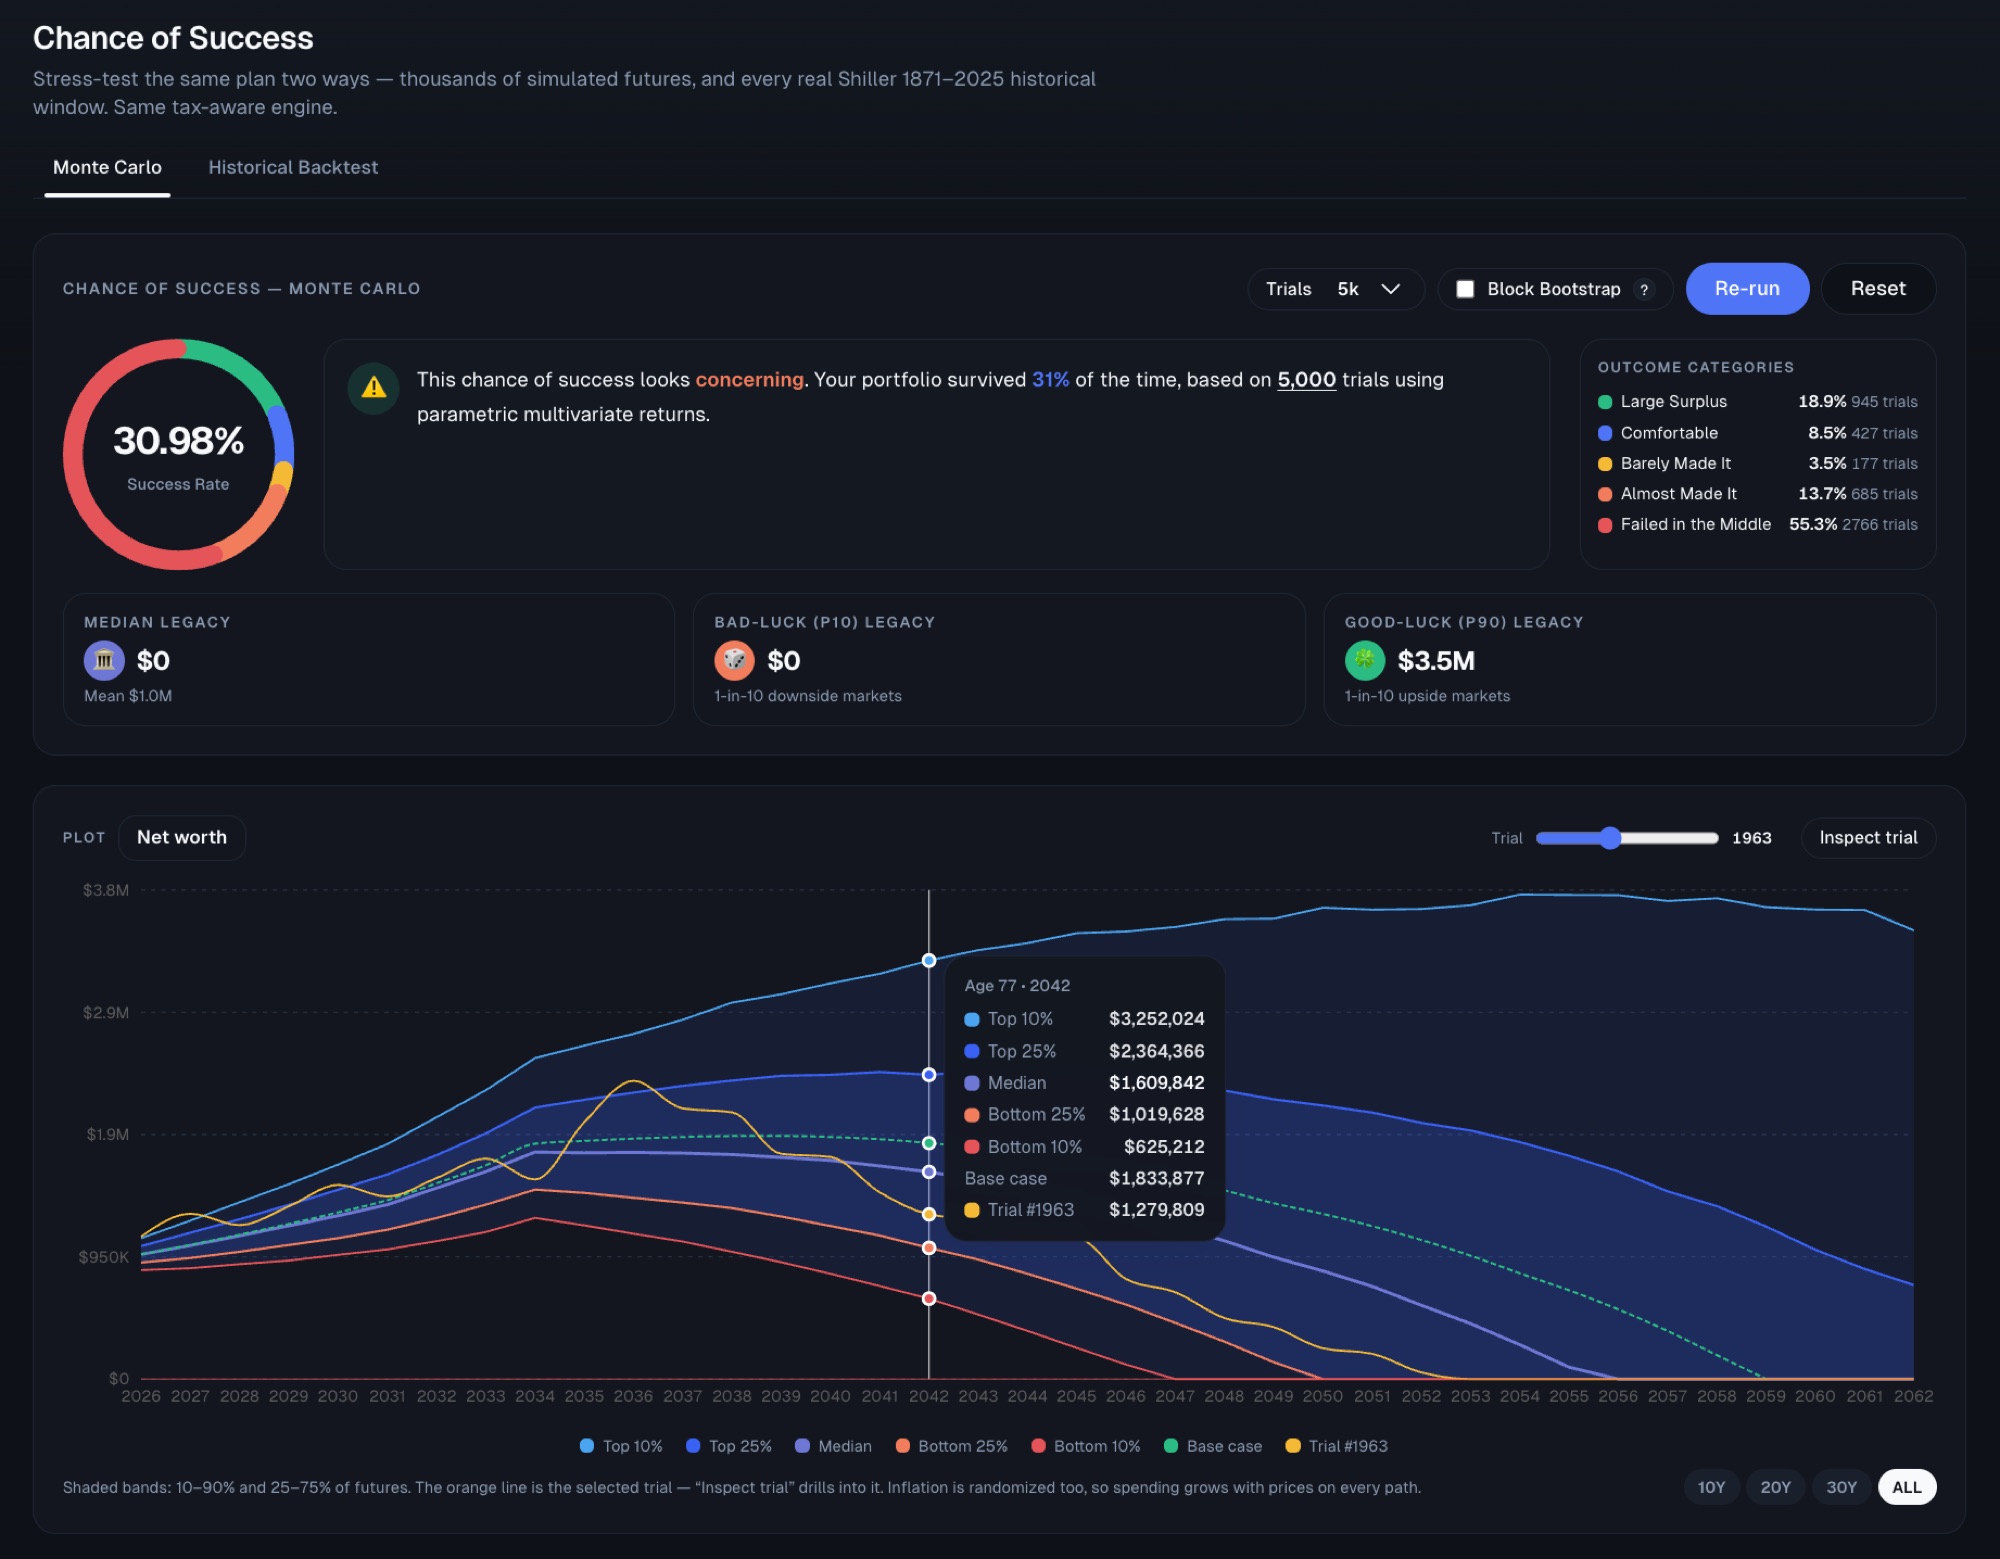
- Success rates across 5,000–10,000 simulated futures, shown as percentile bands rather than a single line.
- Outcome buckets — from large surplus to failed in the middle — so you can see the shape of the risk.
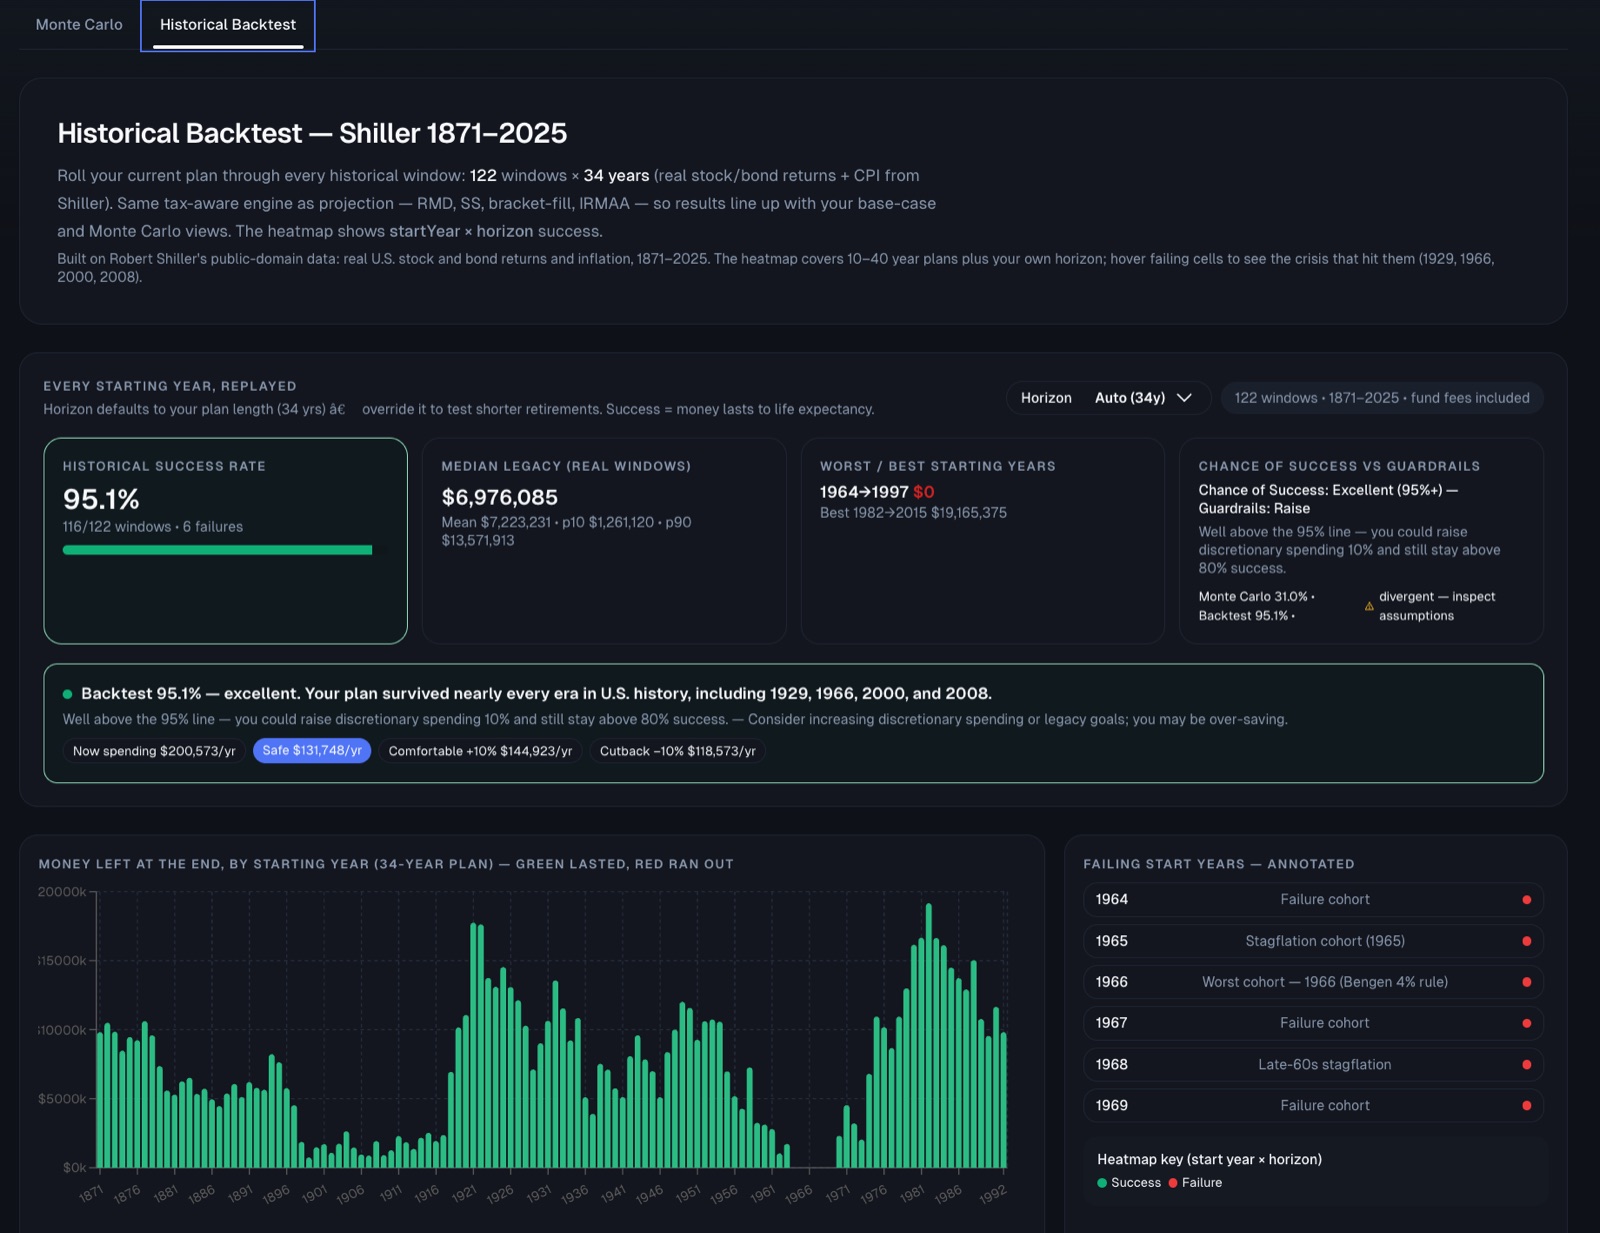
- Every historical start year since 1871 replayed, including 1929, 1966, 2000, and 2008.
- Median, bad-luck (P10), and good-luck (P90) legacies at a glance.
- Stress-test spending, returns, and longevity assumptions side by side with history.
Historical backtest
Every starting year since 1871, replayed through the same engine — 122 windows of real stock, bond, and inflation data. The bars show what was left at the end of each window, and the annotated list names the failures, from the 1964 failure cohort to the 1966 worst case that defined the 4% rule.
Heatmap and trial replay
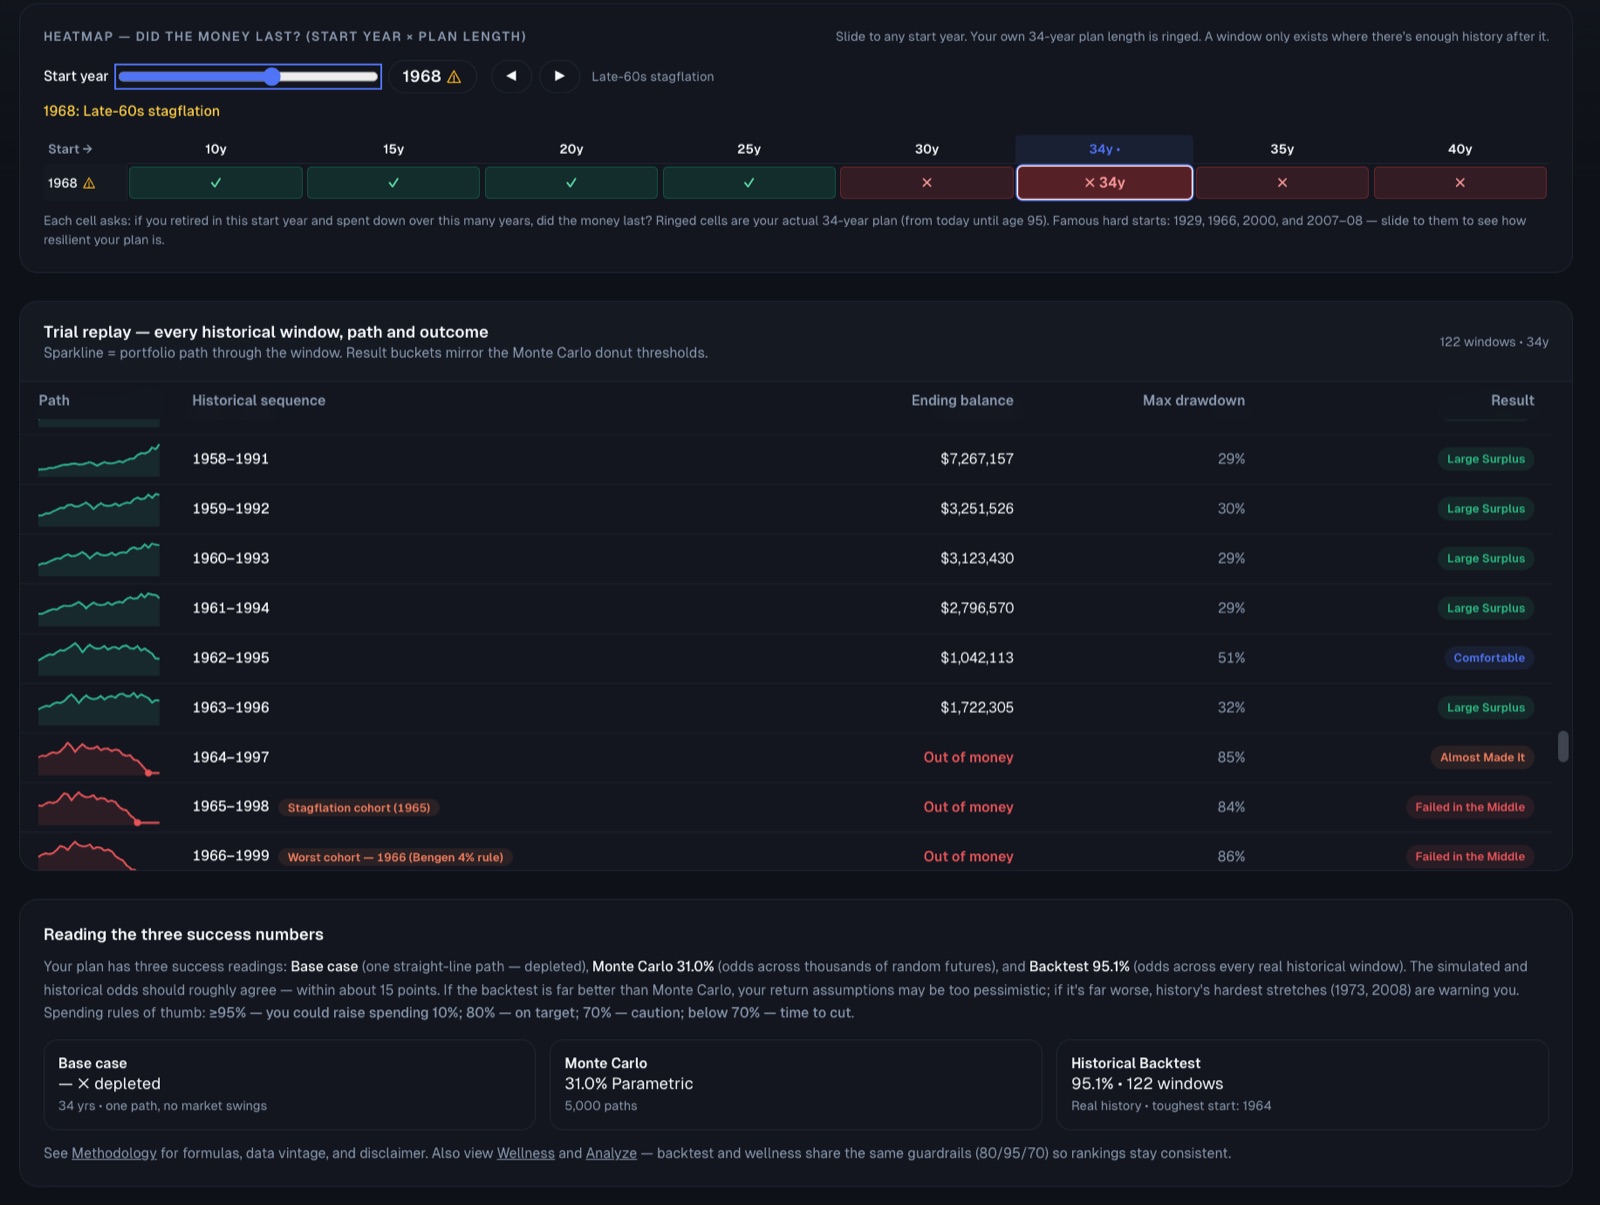
Slide to any start year and plan length to see whether the money lasted — green where it did, red where it ran out. Below, every window is listed with its ending balance, maximum drawdown, and outcome, alongside all three success readings: base case, Monte Carlo, and historical backtest.