Tax Analytics
A detailed look at what your plan costs in taxes over time — bracket by bracket, year by year — plus the levers to change it.
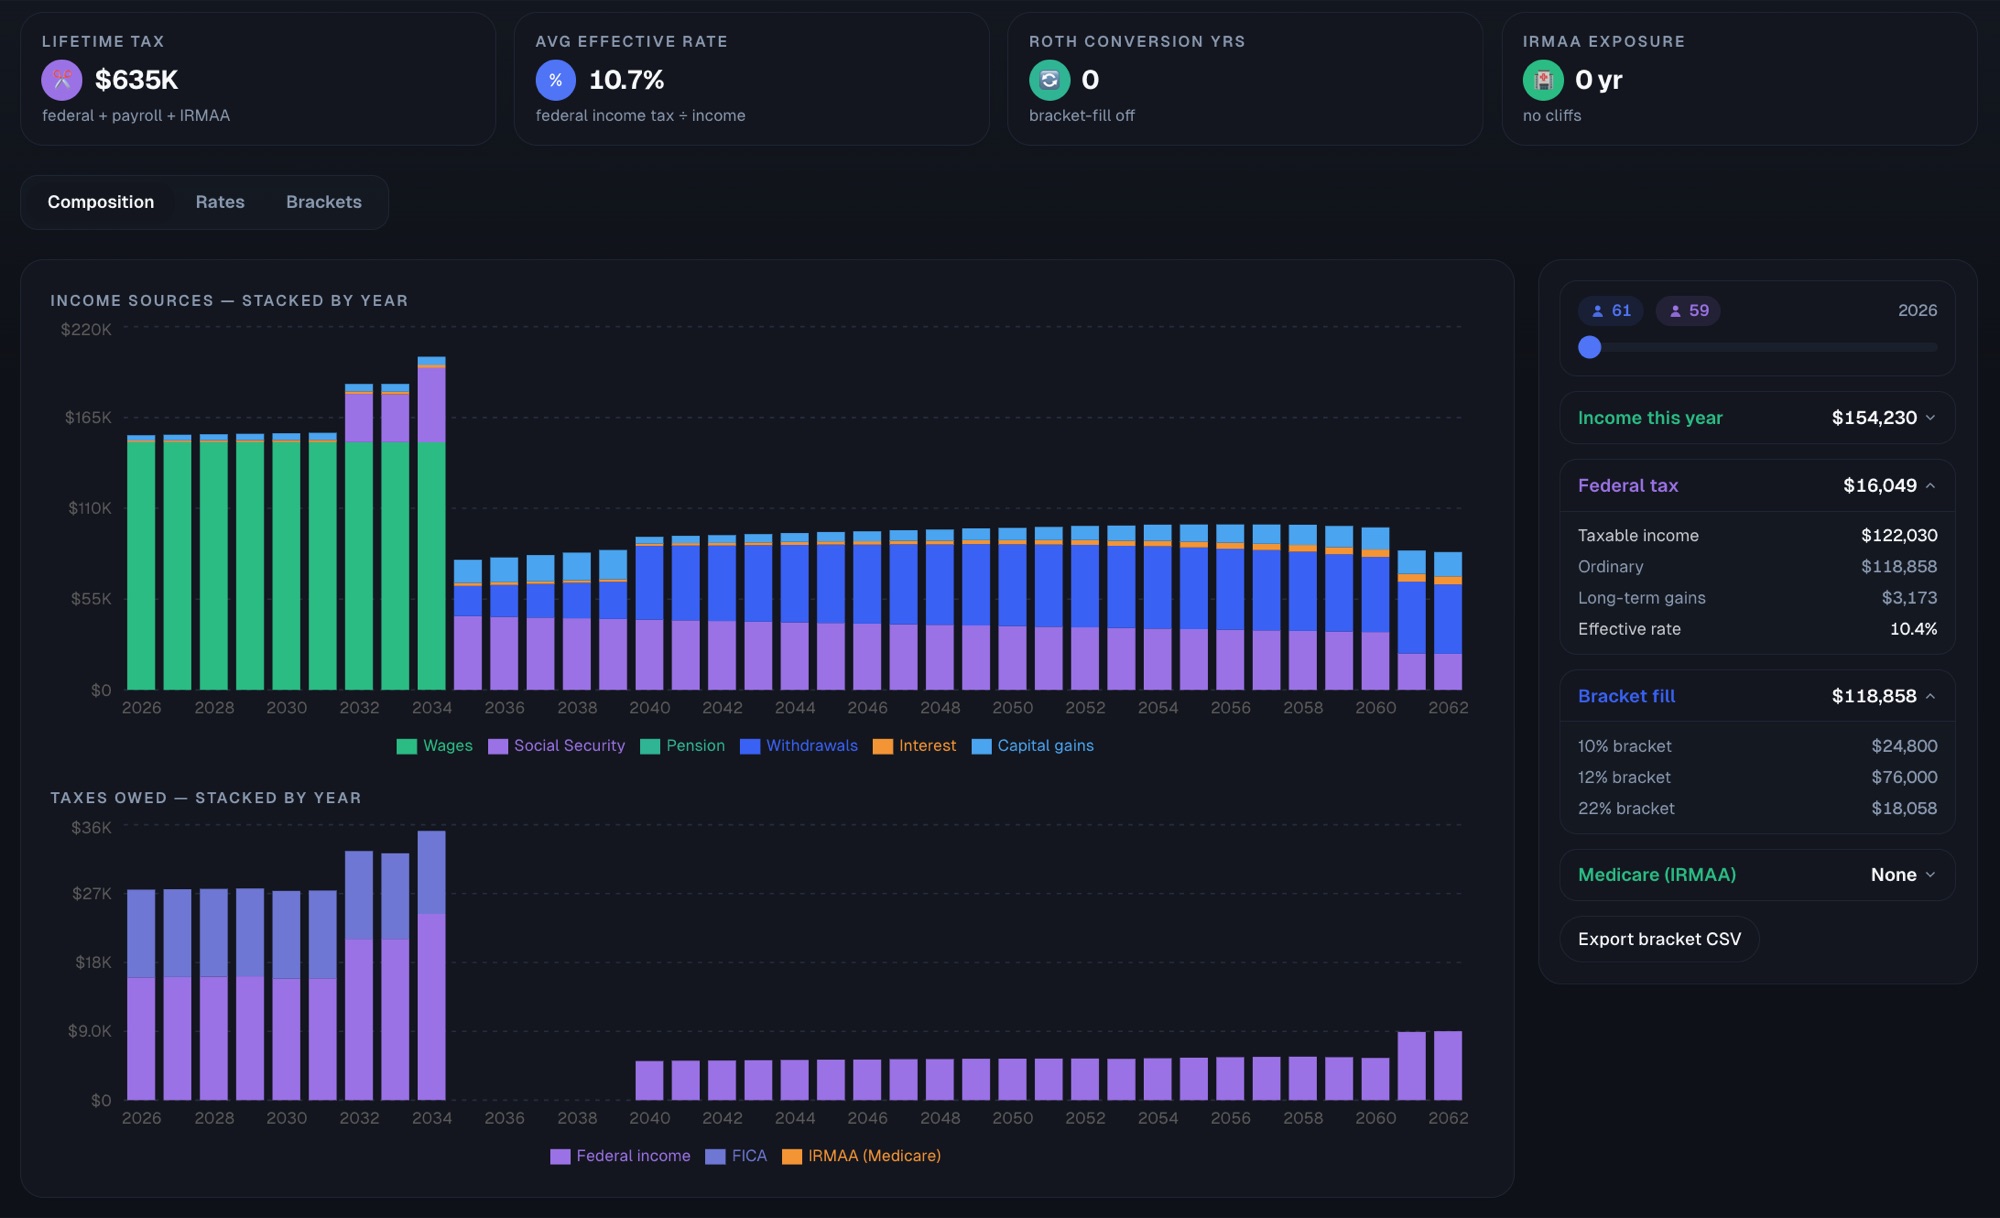
- Effective and marginal rates across the whole plan.
- Bracket, capital-gains, and IRMAA breakdowns by year.
- Spot the years where a small change saves the most.
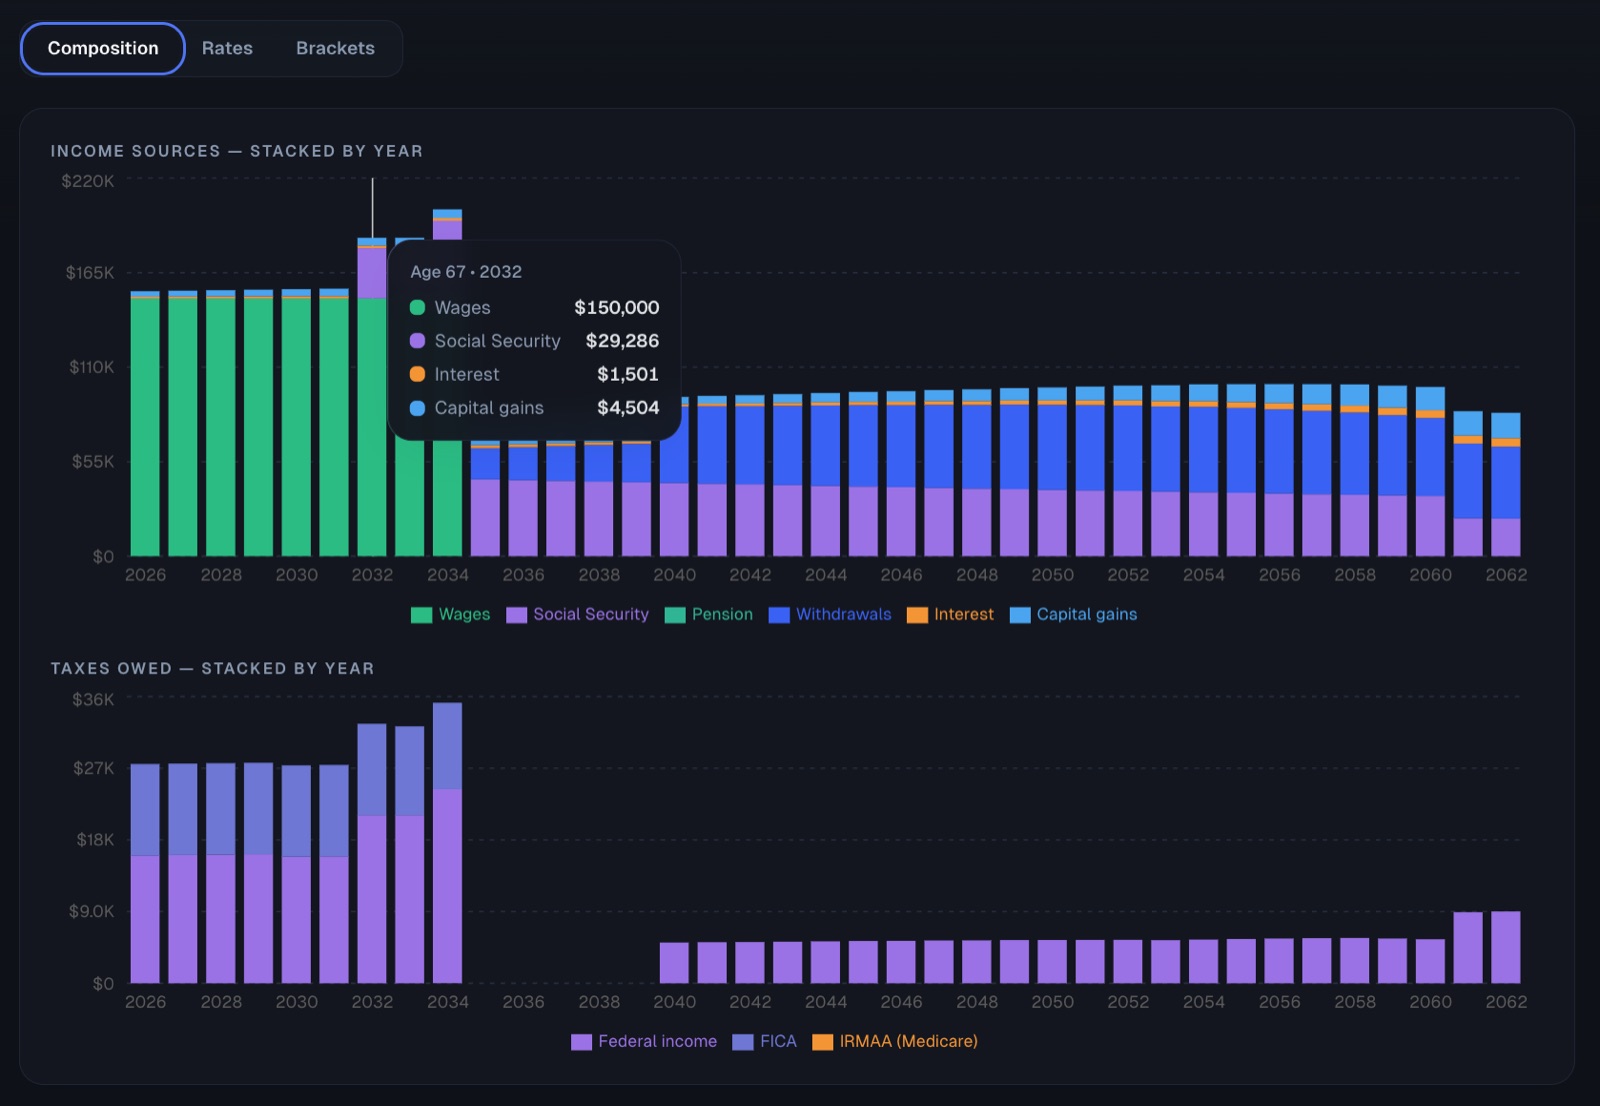
Composition
Every dollar, by source and year — wages, Social Security, withdrawals, interest, and capital gains. Hover any year to see exactly what made up the income and what it cost in taxes.
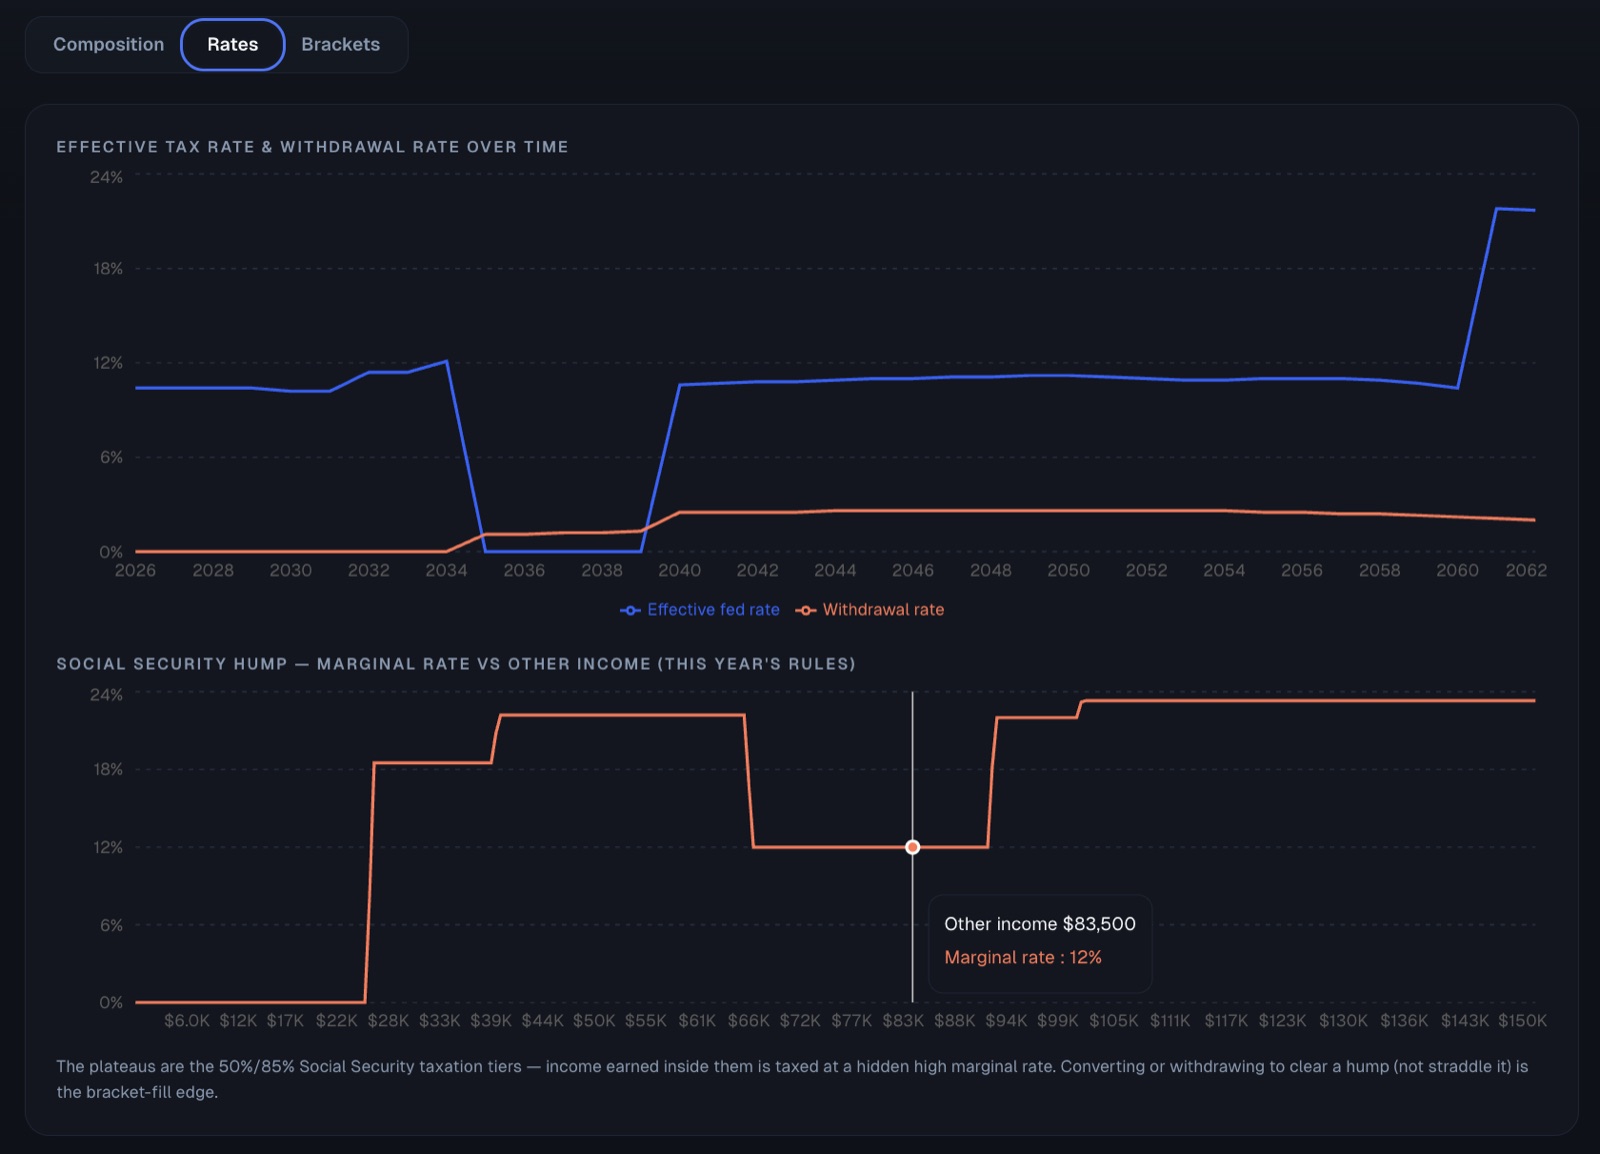
Rates
Effective tax rate and withdrawal rate, tracked year by year. The lower chart exposes the Social Security tax hump — the hidden marginal-rate plateaus created by the 50% and 85% benefit-taxation tiers — so you can see where a conversion clears a hump instead of straddling it.
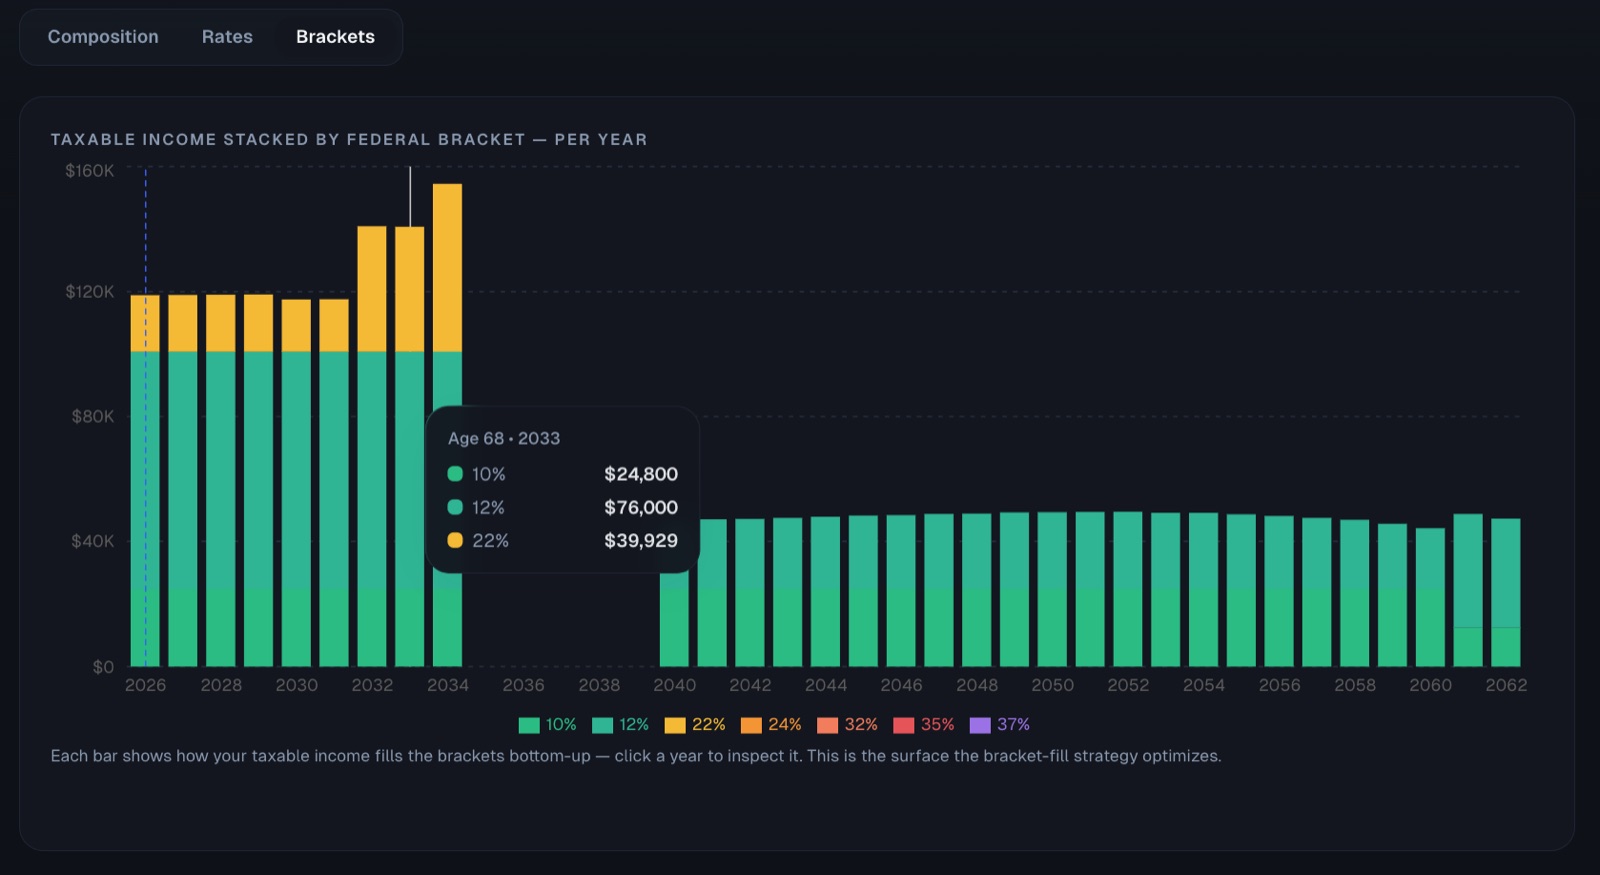
Brackets
Taxable income stacked by federal bracket and filled bottom-up, so you can see at a glance which years still have room in the 12% or 22% bracket and which are already full. This is the surface the bracket-fill strategy optimizes.