Dashboard
The dashboard is the overall picture: your plan projected year by year with federal taxes, Social Security, RMDs, and Roth conversions, plus the verdict on how it holds up. Everything is computed in your browser.
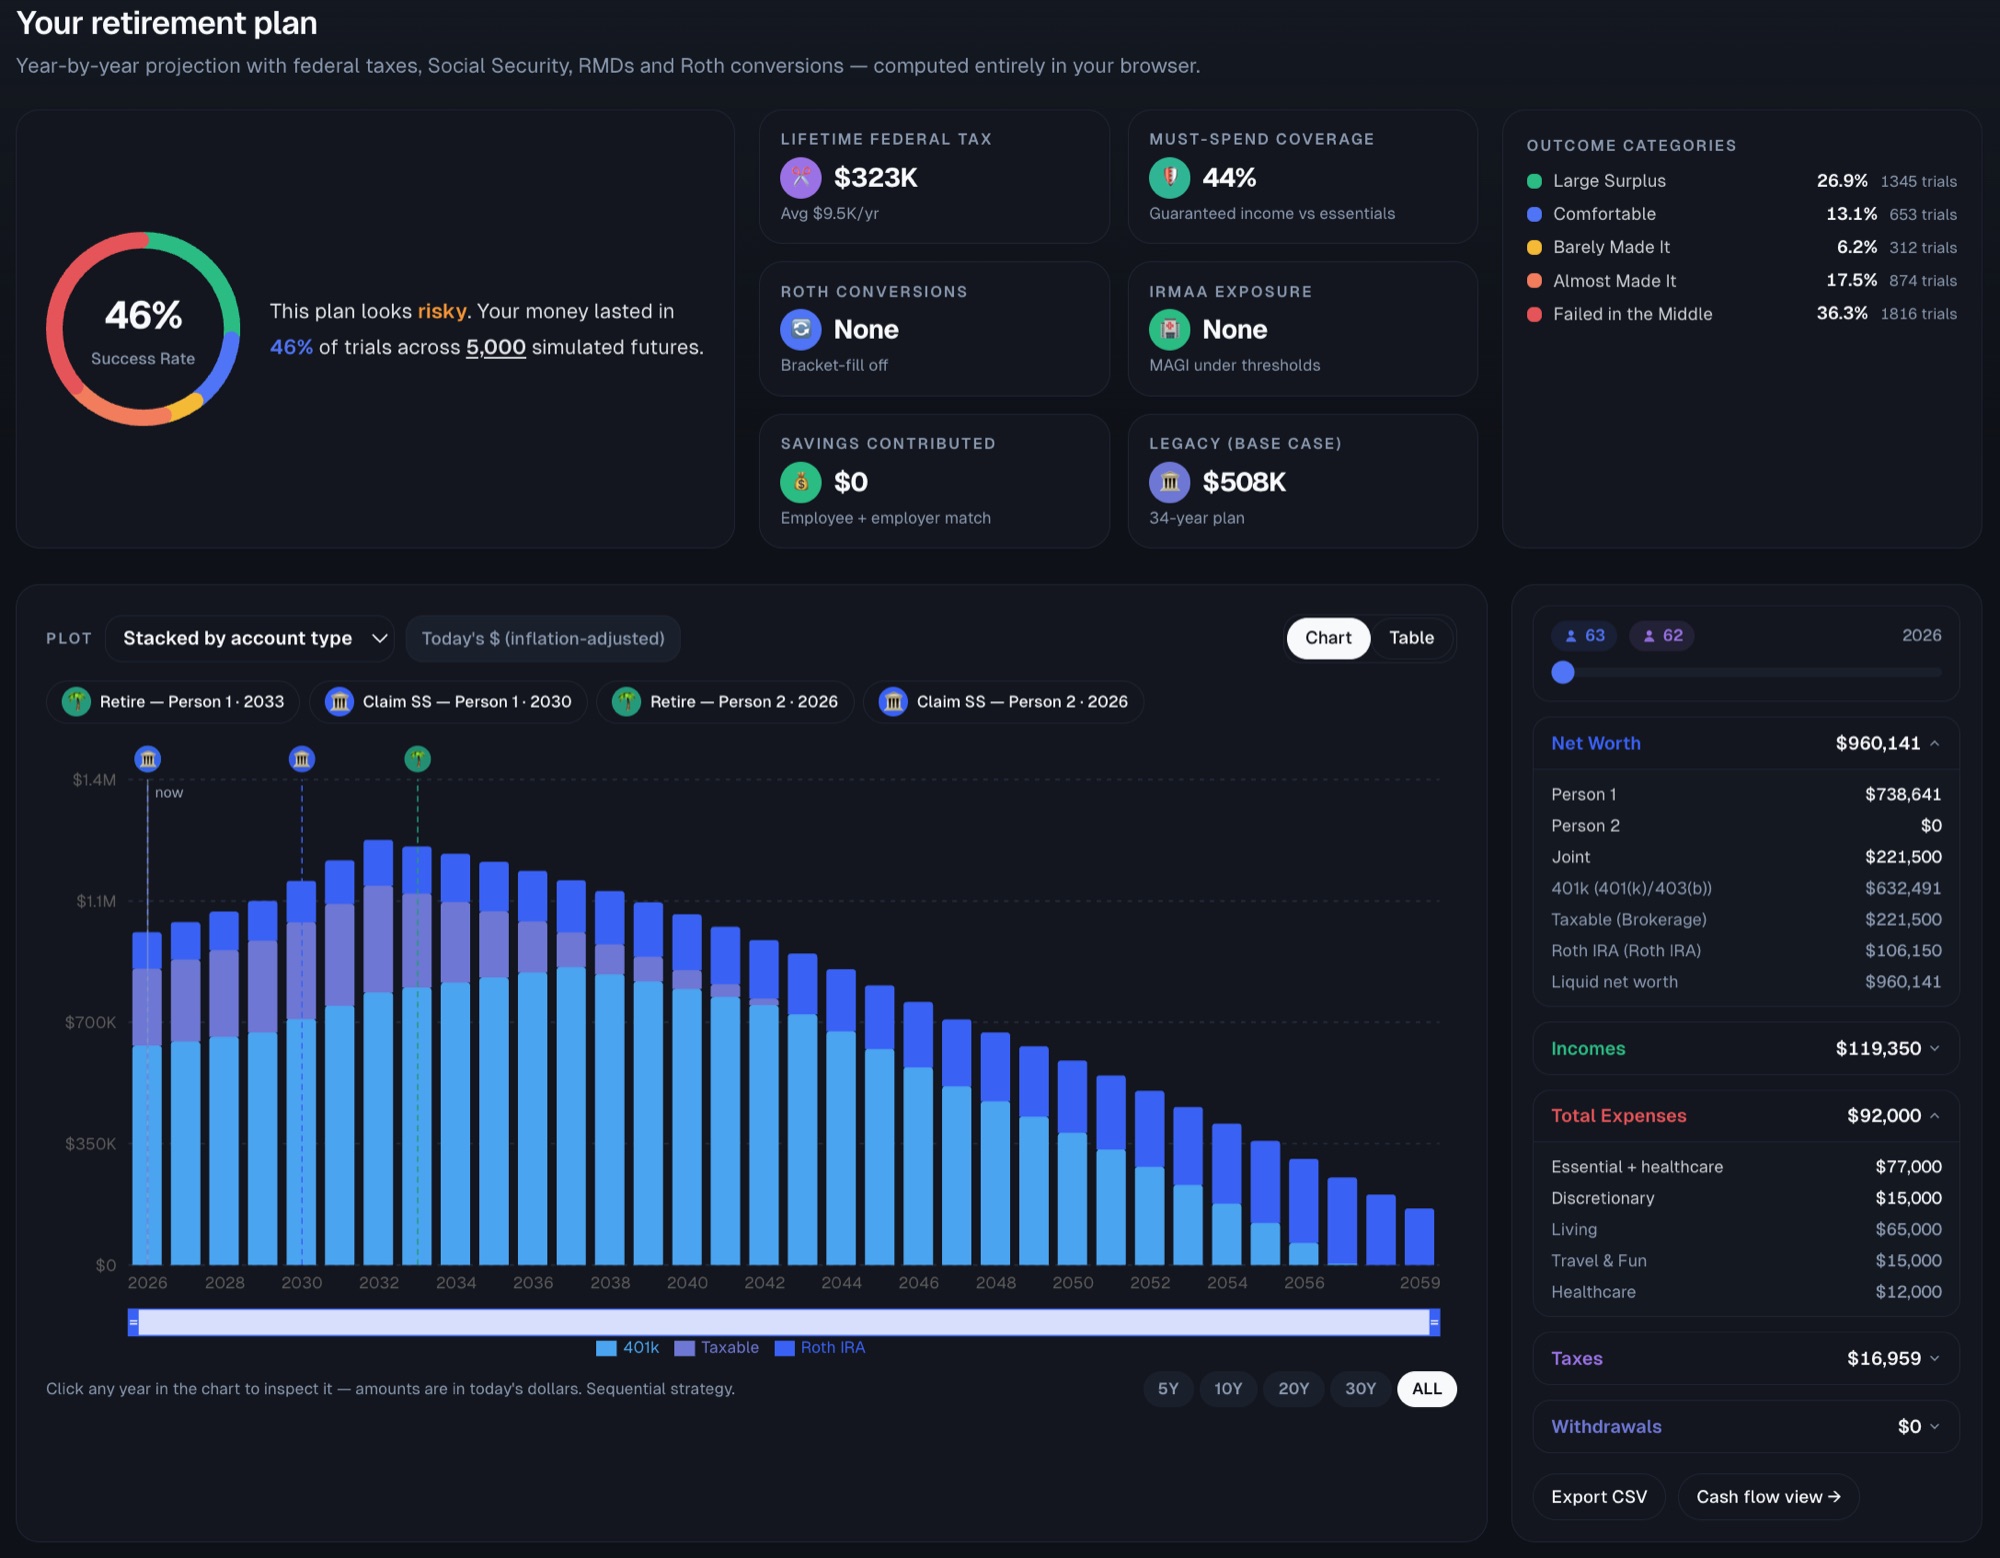
- See the full projection, year by year, across every account and milestone.
- Read the verdict: chance of success, must-spend coverage, legacy, and lifetime federal tax.
- Inspect any year — net worth by person and account, income, expenses, taxes, and withdrawals.
- Switch between chart and table, view amounts in today’s dollars, and export the CSV.
- Edit balances and expense amounts in place, with the simulation updating instantly.
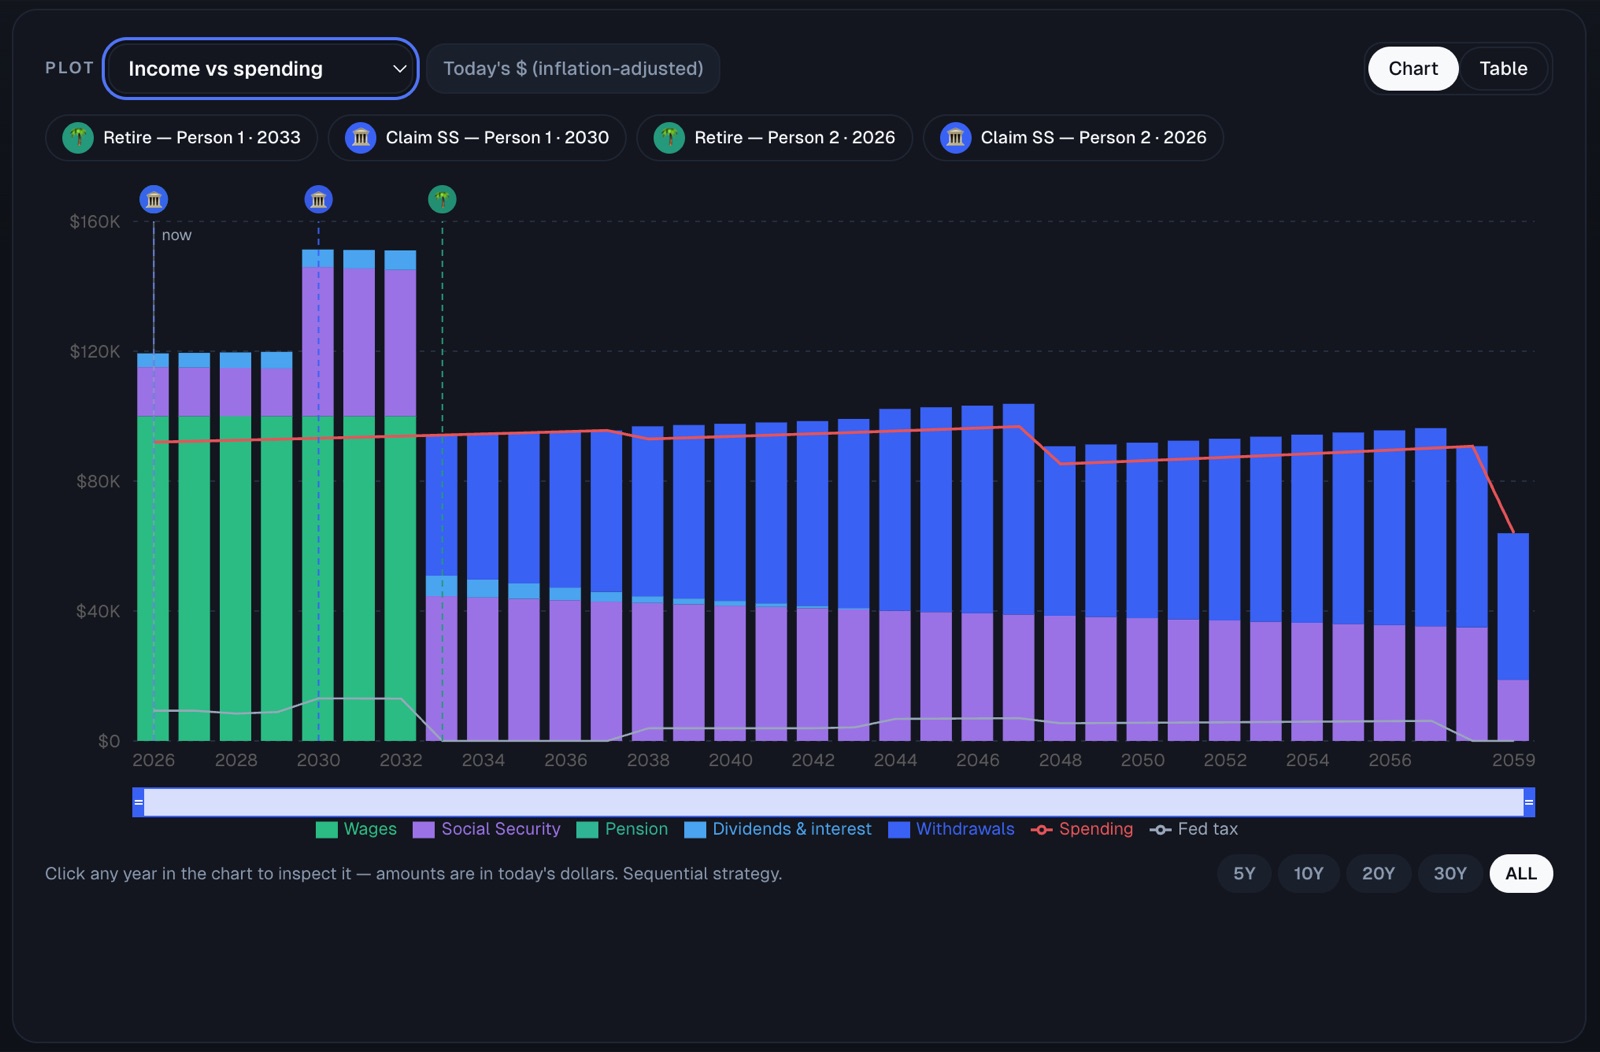
Income vs spending
Switch the plot to income versus spending and the plan reads as a story: wages give way to Social Security and portfolio withdrawals, while the spending line shows what has to be funded and the federal tax line shows what it costs. Milestone markers flag retirements and Social Security claim ages.
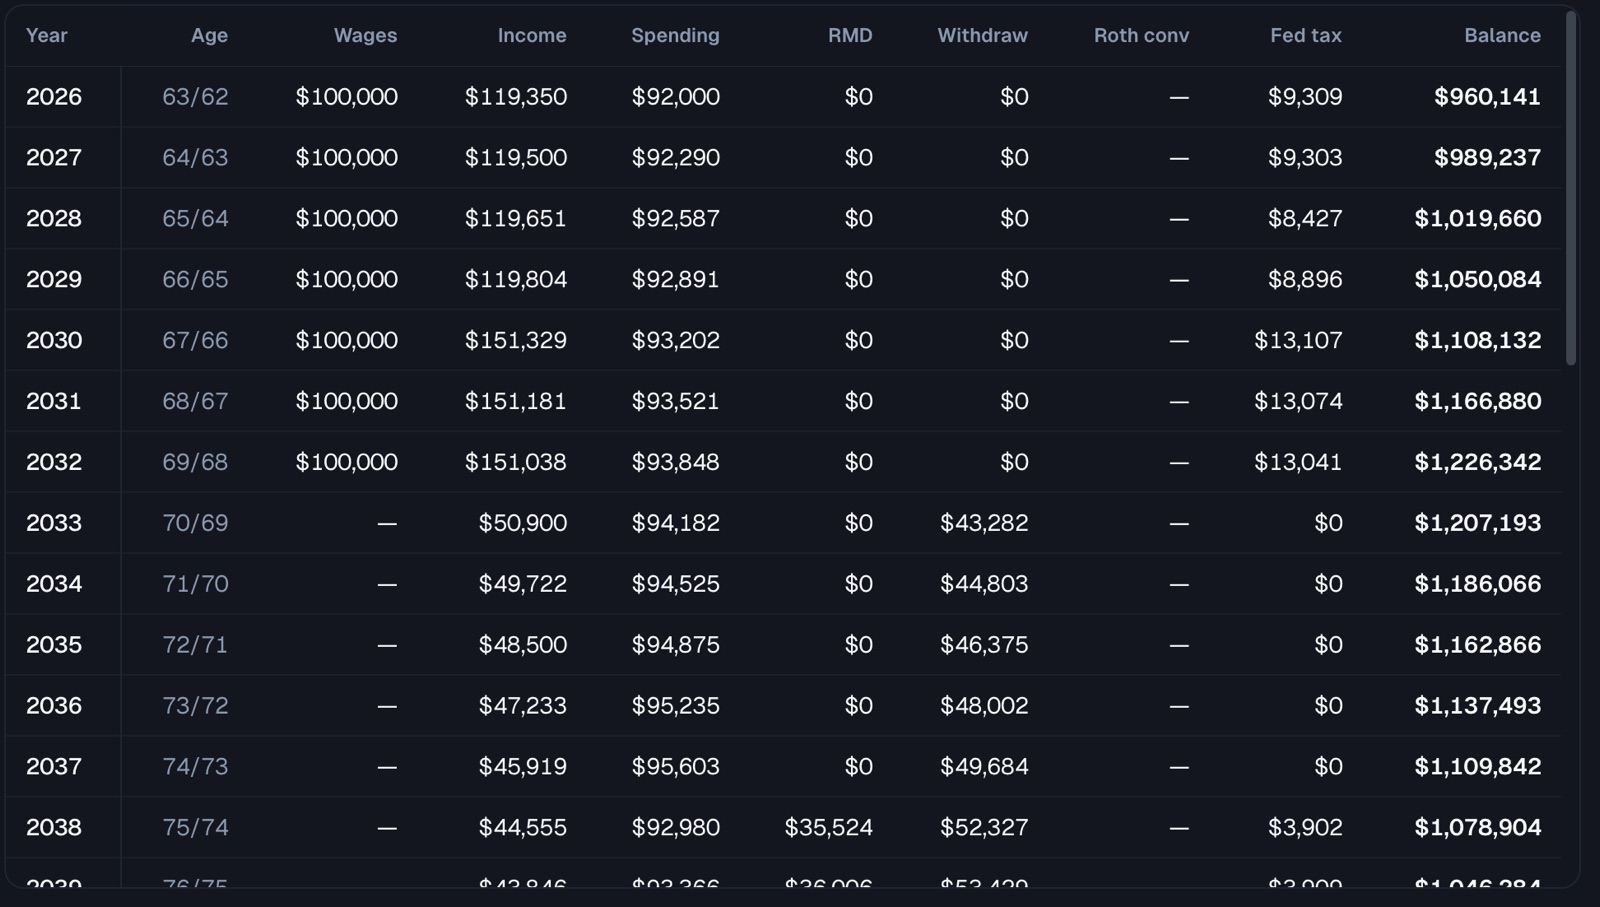
The year-by-year table
Every projection year as a row: ages, wages, total income, spending, RMDs, withdrawals, Roth conversions, federal tax, and ending balance. It is the fastest way to find the year a decision finally shows up.
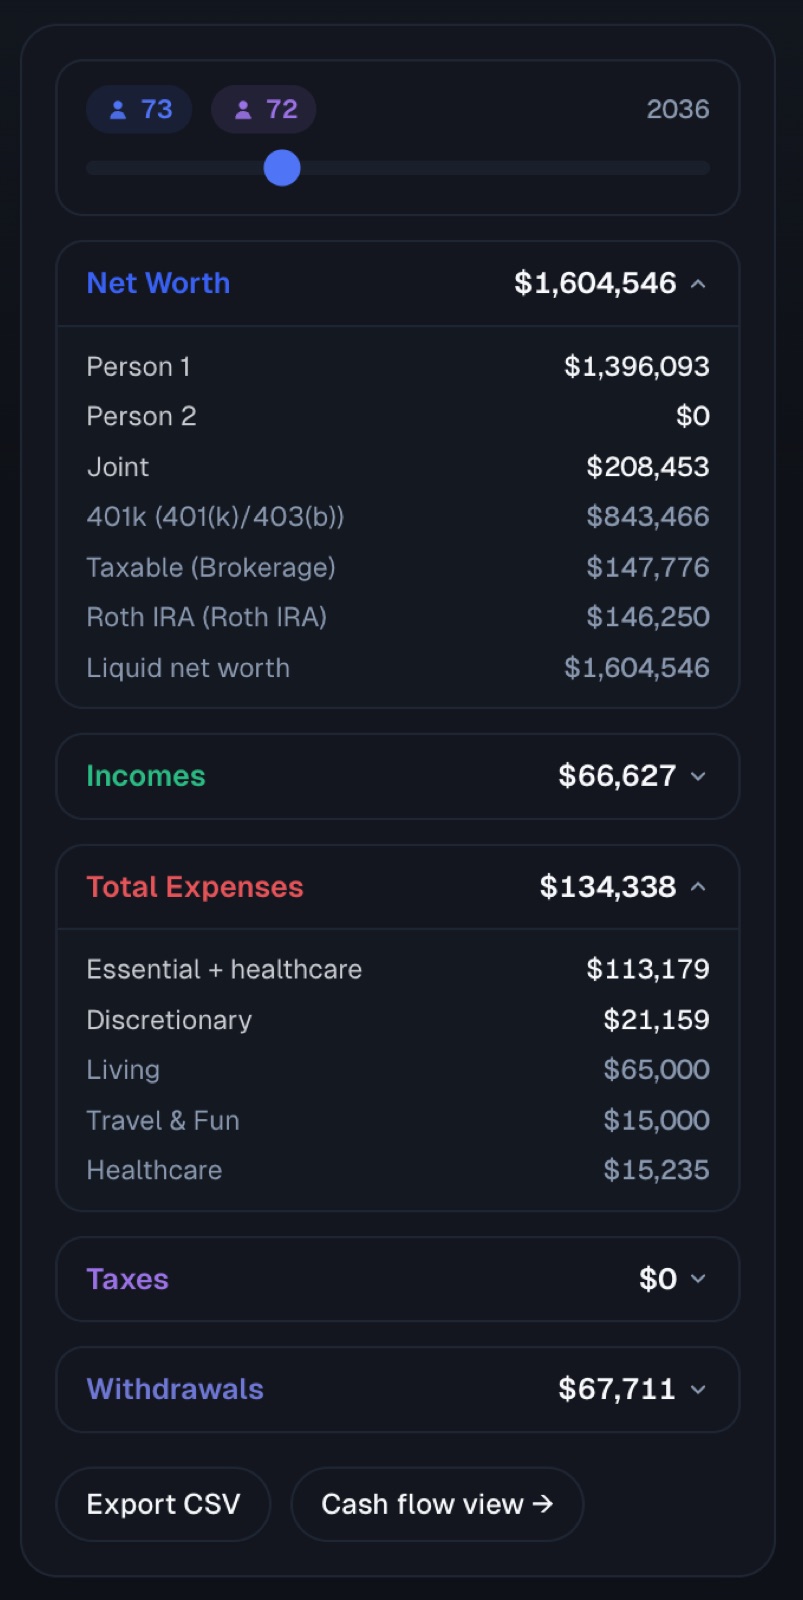
Inspect any year
Scrub to any year — or click one in the chart — and the sidebar breaks it down: net worth by person and account type, income, expenses by category, taxes, and withdrawals, plus a CSV export and a jump to the cash-flow view.
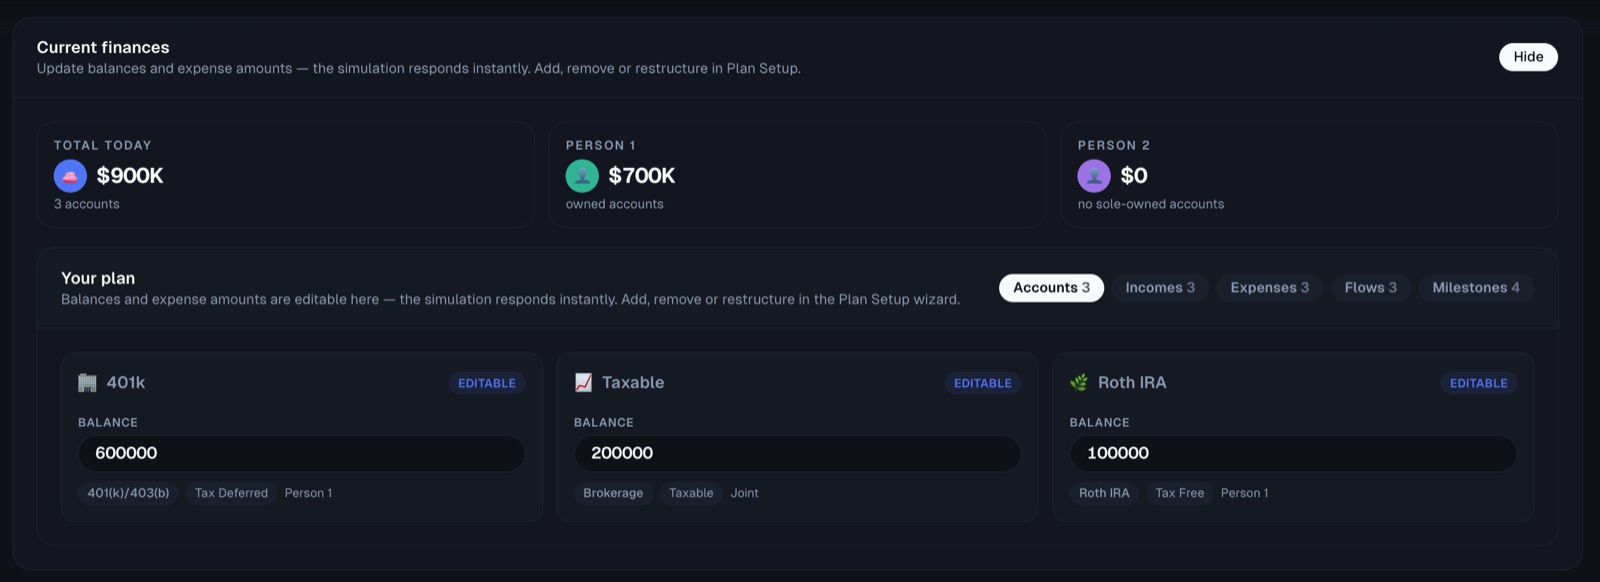
Your plan, editable in place
Current finances show what you own today, in total and per person, and the underlying accounts, incomes, expenses, flows, and milestones are editable right on the dashboard. Change a balance or an expense amount and the simulation responds instantly; restructure in Plan Setup when you need to.