Tax Planner
Line up your income, deductions, and withdrawals for the current year and see how each one moves your bracket, your Medicare premiums, and your marketplace subsidy.
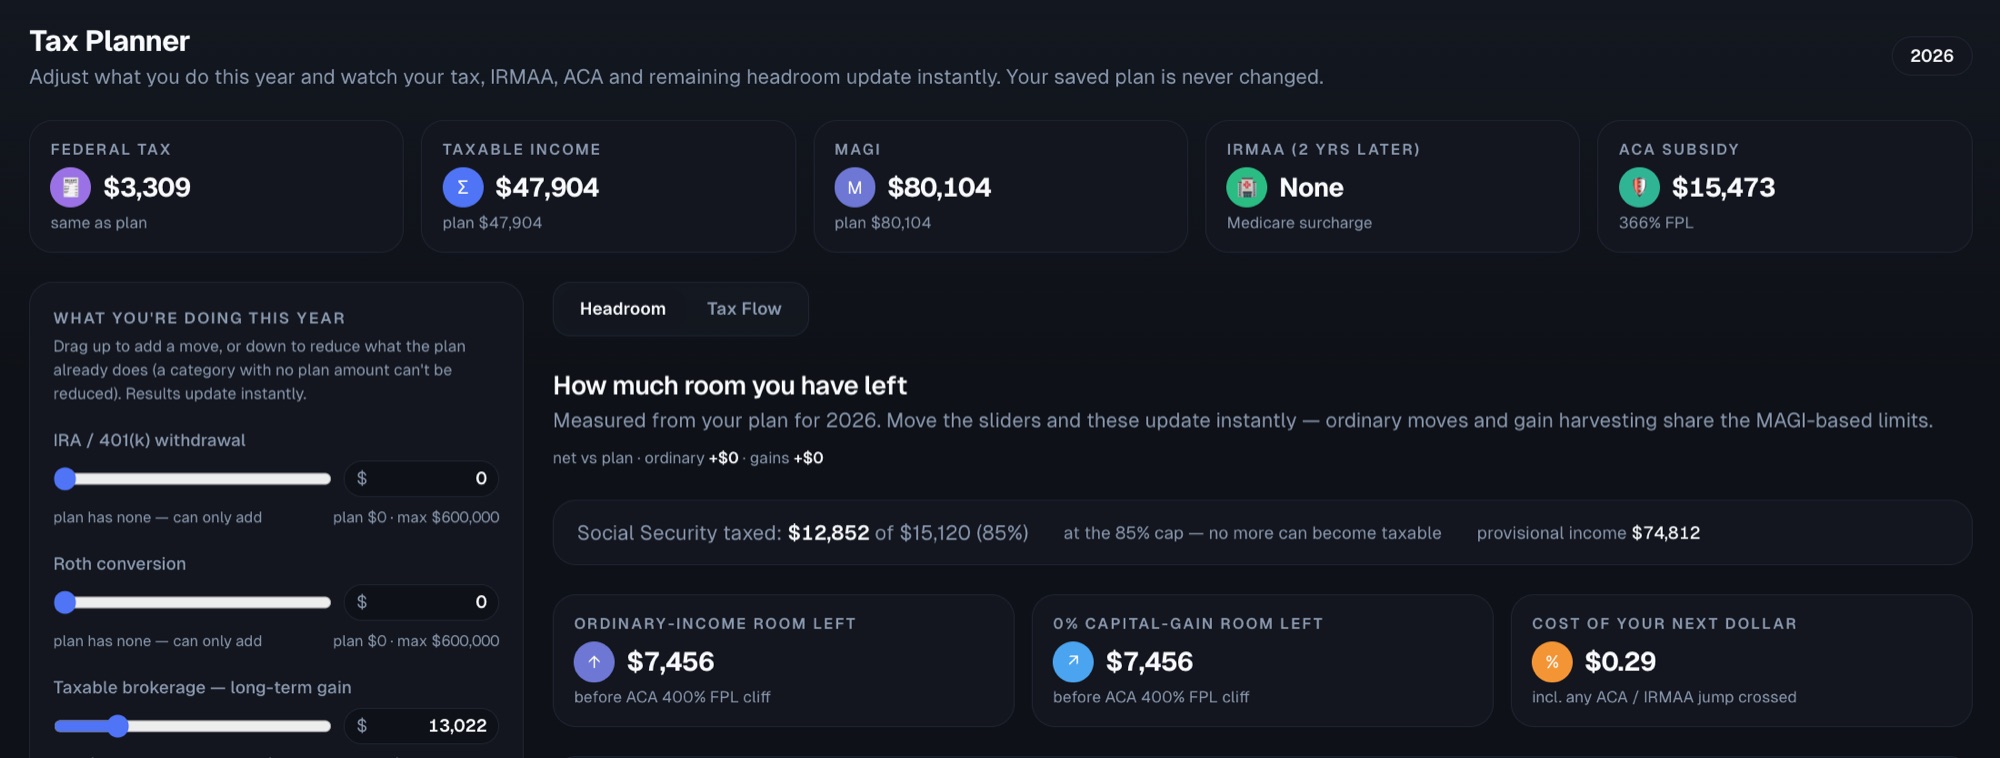
- See the true marginal cost of your next dollar — cliff jumps included.
- Find the room left in your bracket before IRMAA or the ACA subsidy phase-out.
- Model Roth conversions, capital gains, and IRA withdrawals side by side.
- Watch the whole year as a tax-flow diagram.
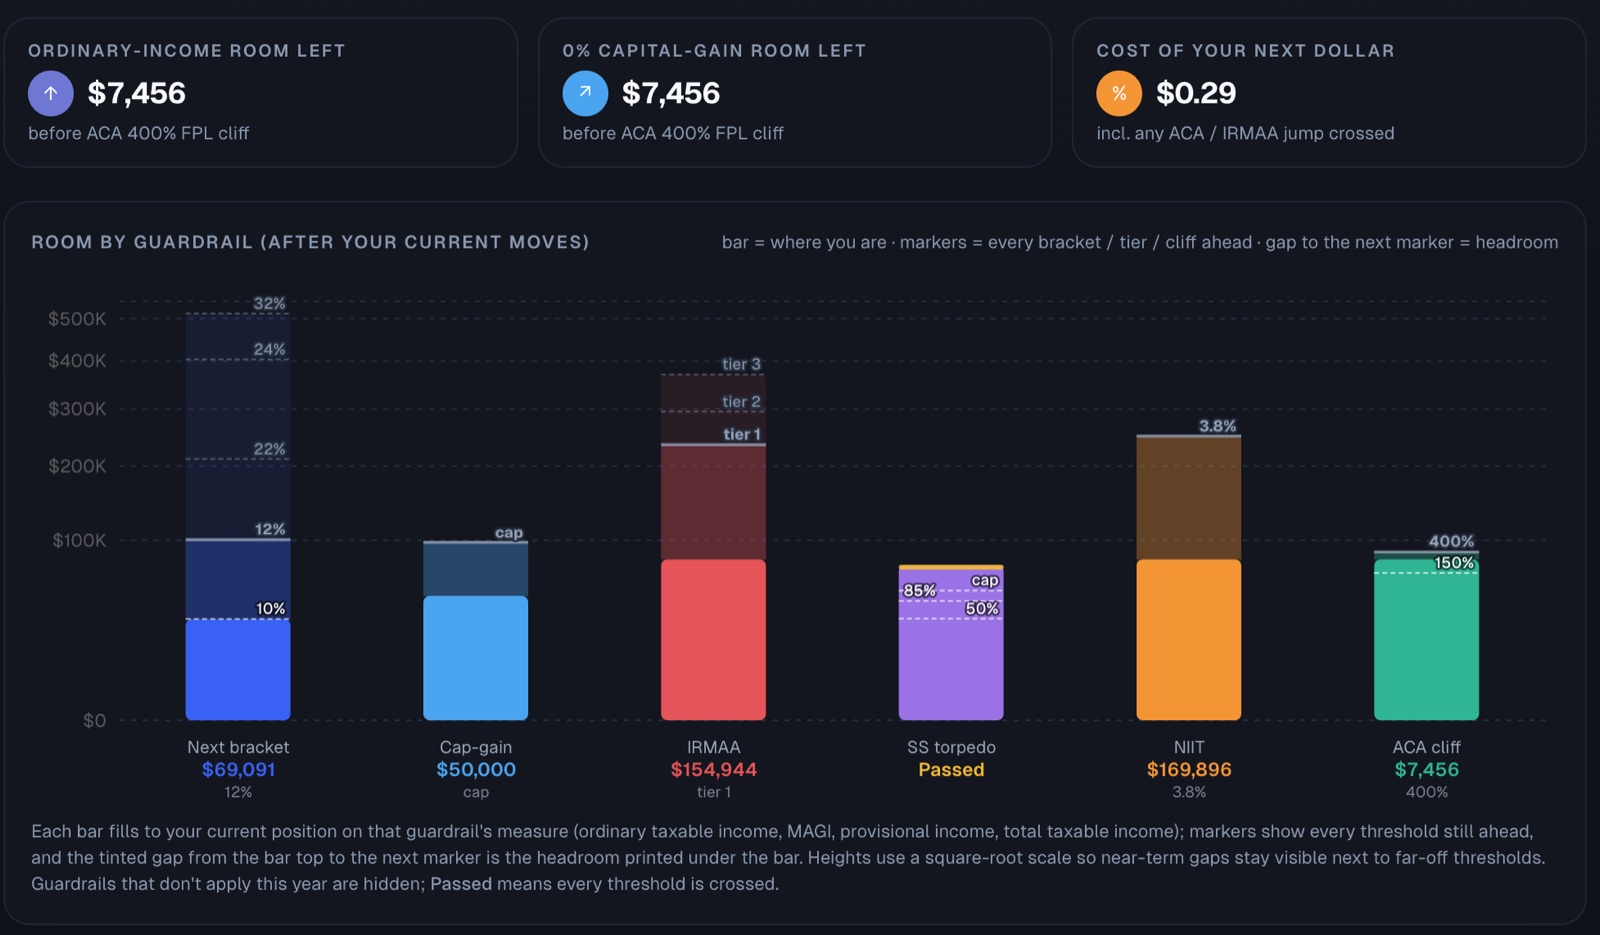
Headroom, guardrail by guardrail
After your current moves, every cliff gets its own bar: the next bracket, the 0% capital-gain cap, IRMAA tiers, the Social Security tax torpedo, NIIT, and the ACA subsidy cliff. The bar shows where you stand, the markers show each threshold still ahead, and the number under it is the room left before the next one.
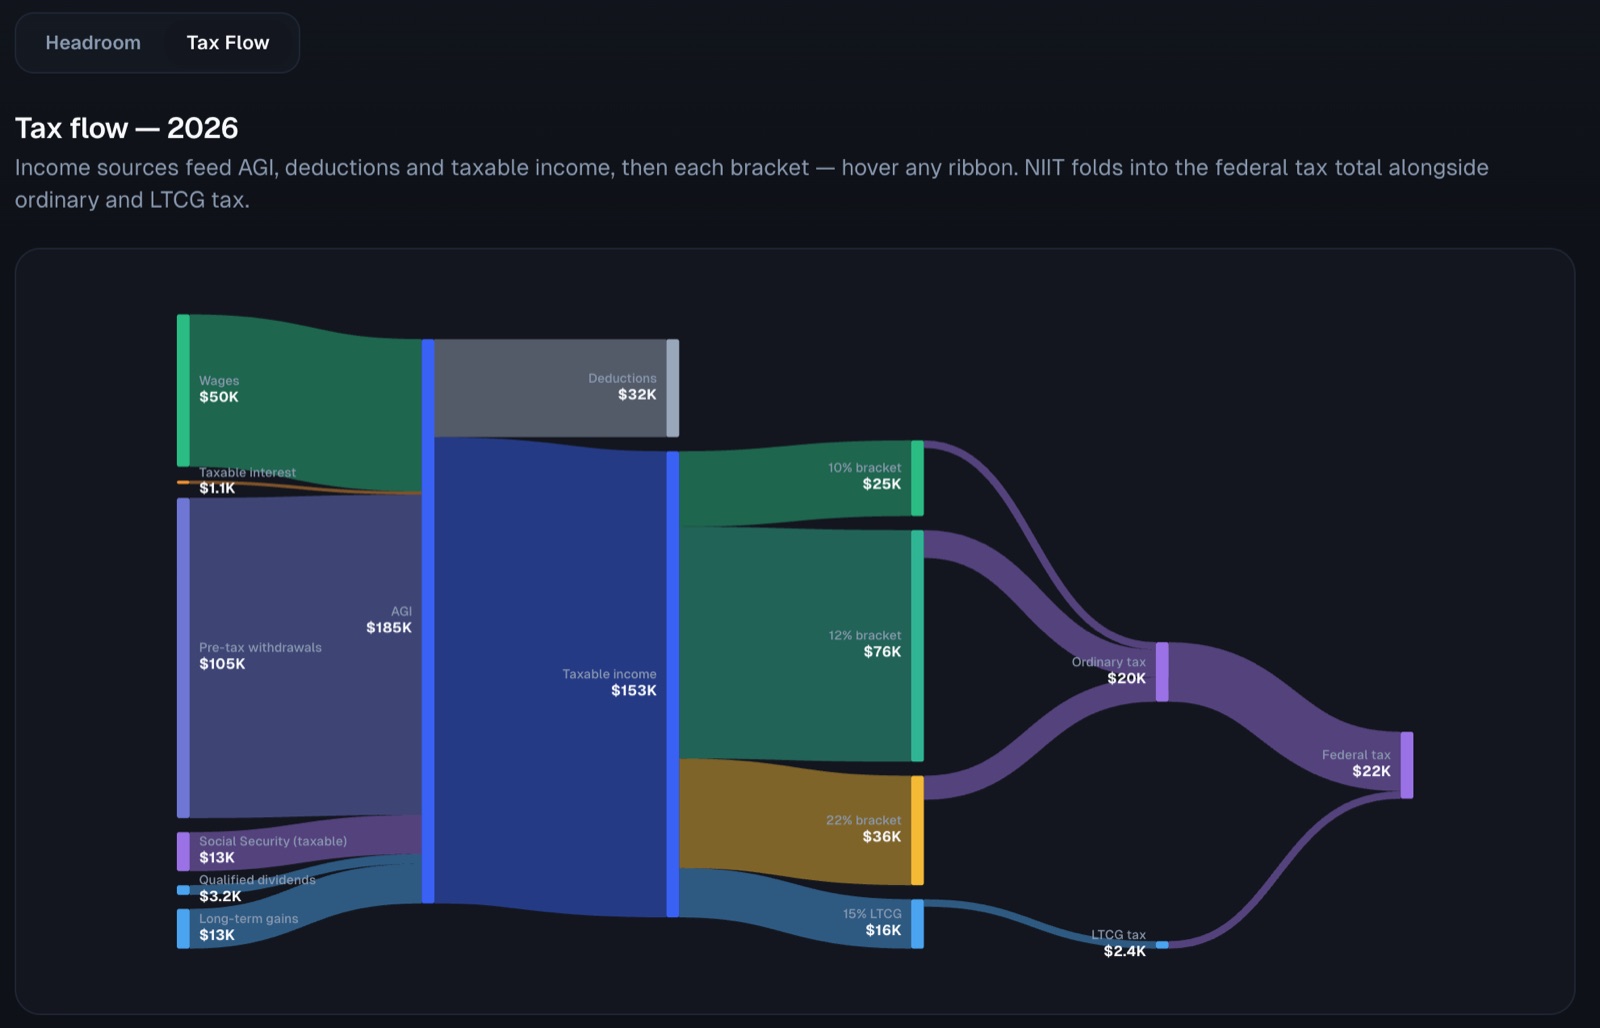
The whole year as a tax-flow diagram
Income sources flow through AGI and deductions into taxable income, then split across the 10%, 12%, and 22% brackets and the 15% long-term capital-gains rate, ending at the federal tax total. Hover any ribbon to trace where a dollar came from and where it went.
Get StartedFree · No account · Runs in your browser