What-If
Pull the dials — when you stop working, when Social Security starts, how much you spend, how much you save — then apply the changes to re-run the engine. See how each choice moves your odds, your tax bill, and how long the money lasts, without touching your saved plan until you say so.
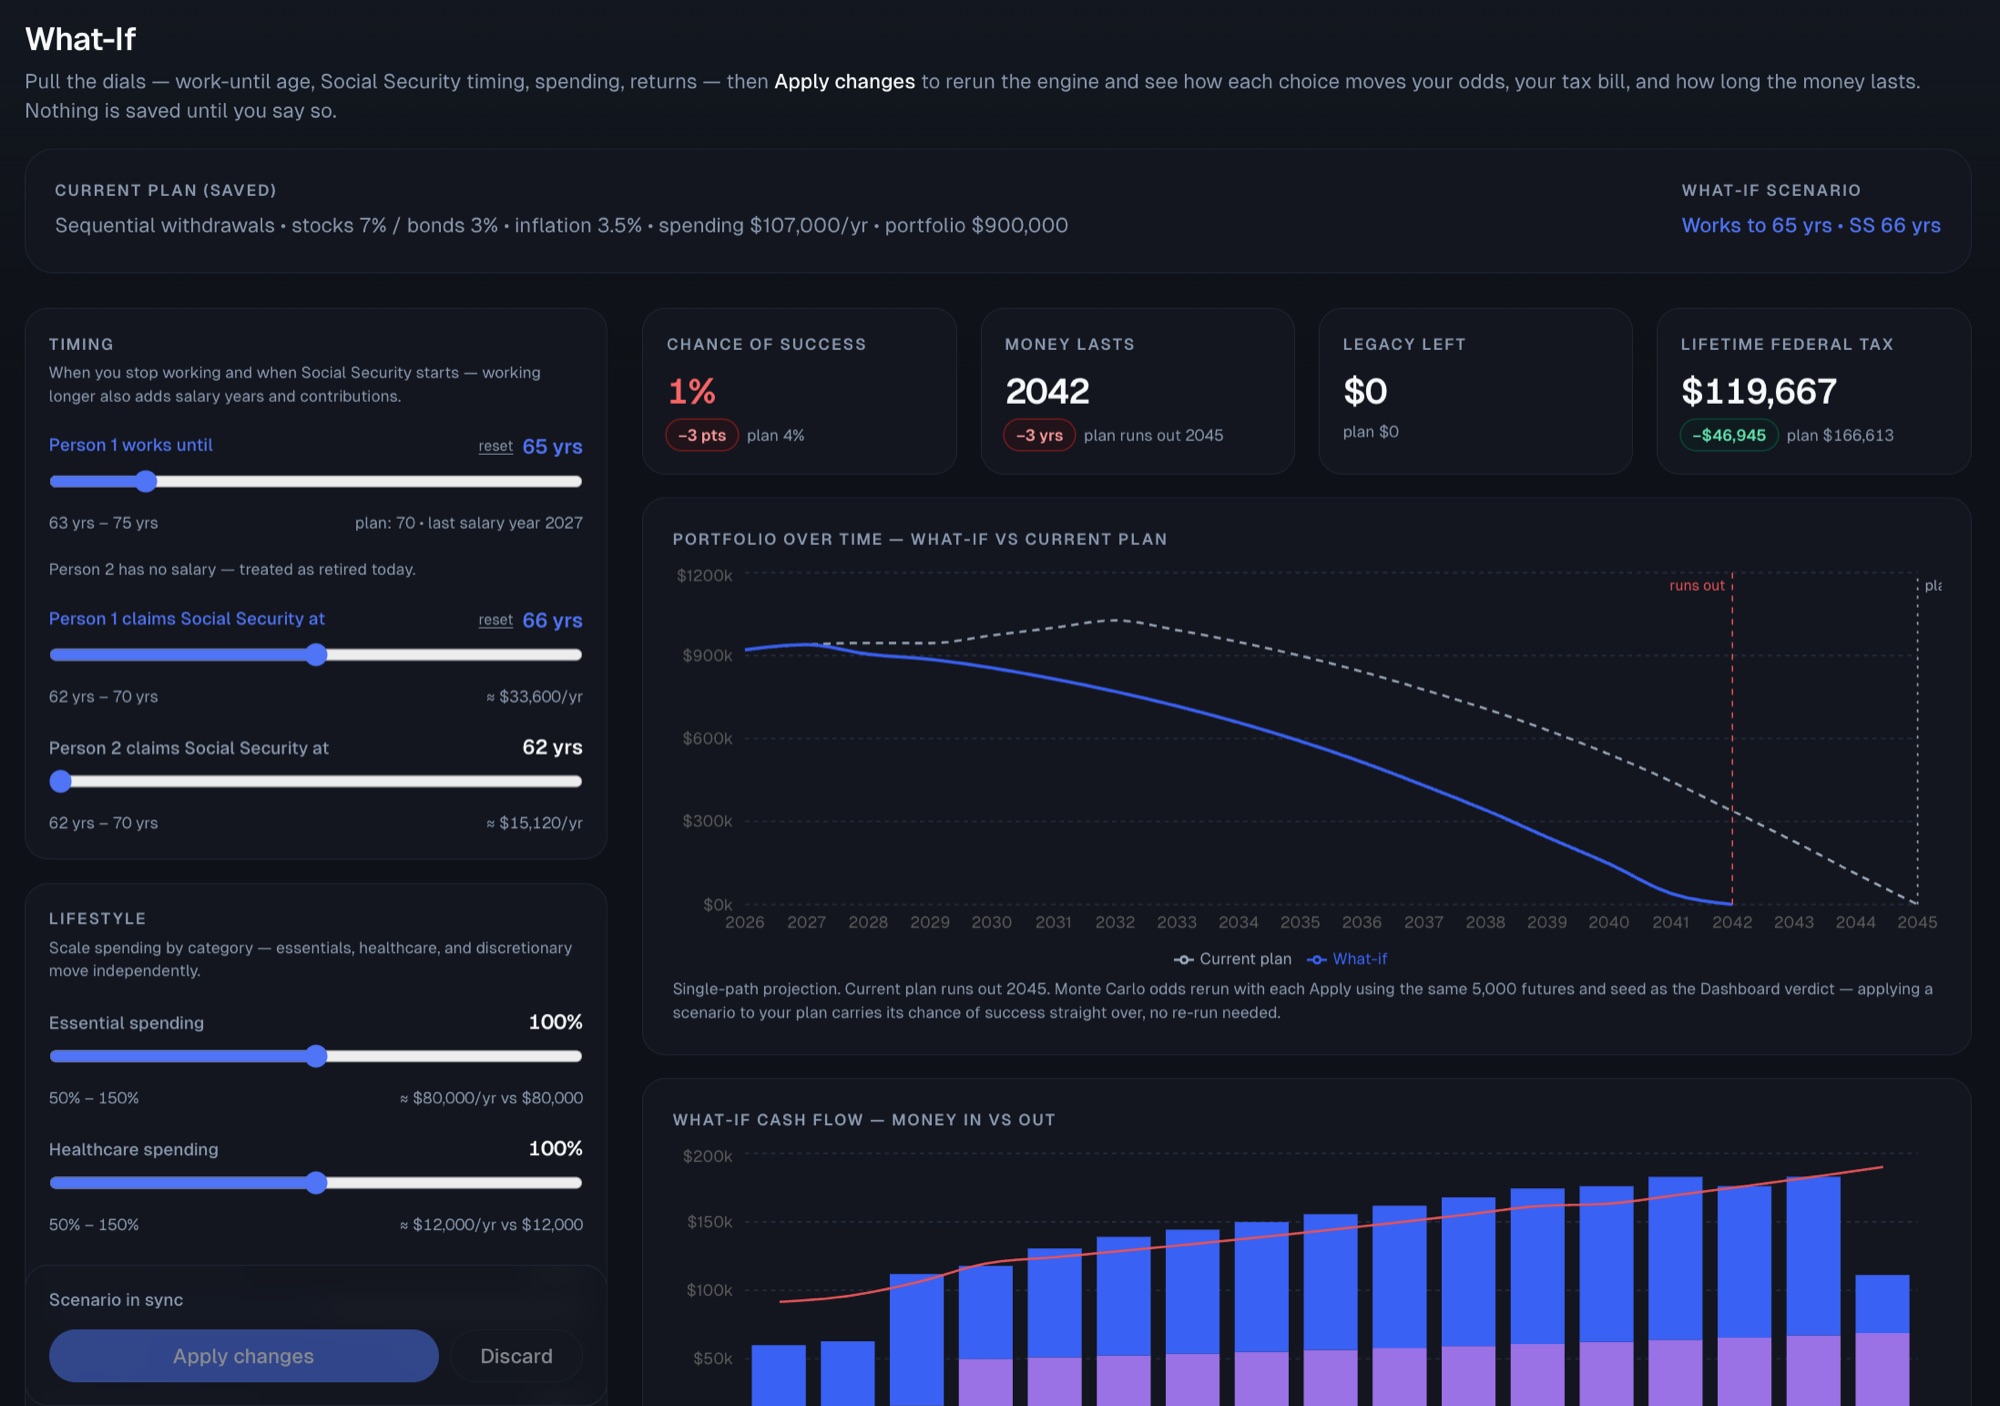
- Change one thing at a time: retirement date, Social Security claim ages, spending by category, or savings rate.
- See the deltas against your plan — chance of success, the year money runs out, legacy, and lifetime federal tax.
- Compare the what-if and the current plan on the same portfolio and cash-flow charts.
- Apply it to your plan, or save it as a scenario for the Compare page.
See the deltas before you commit
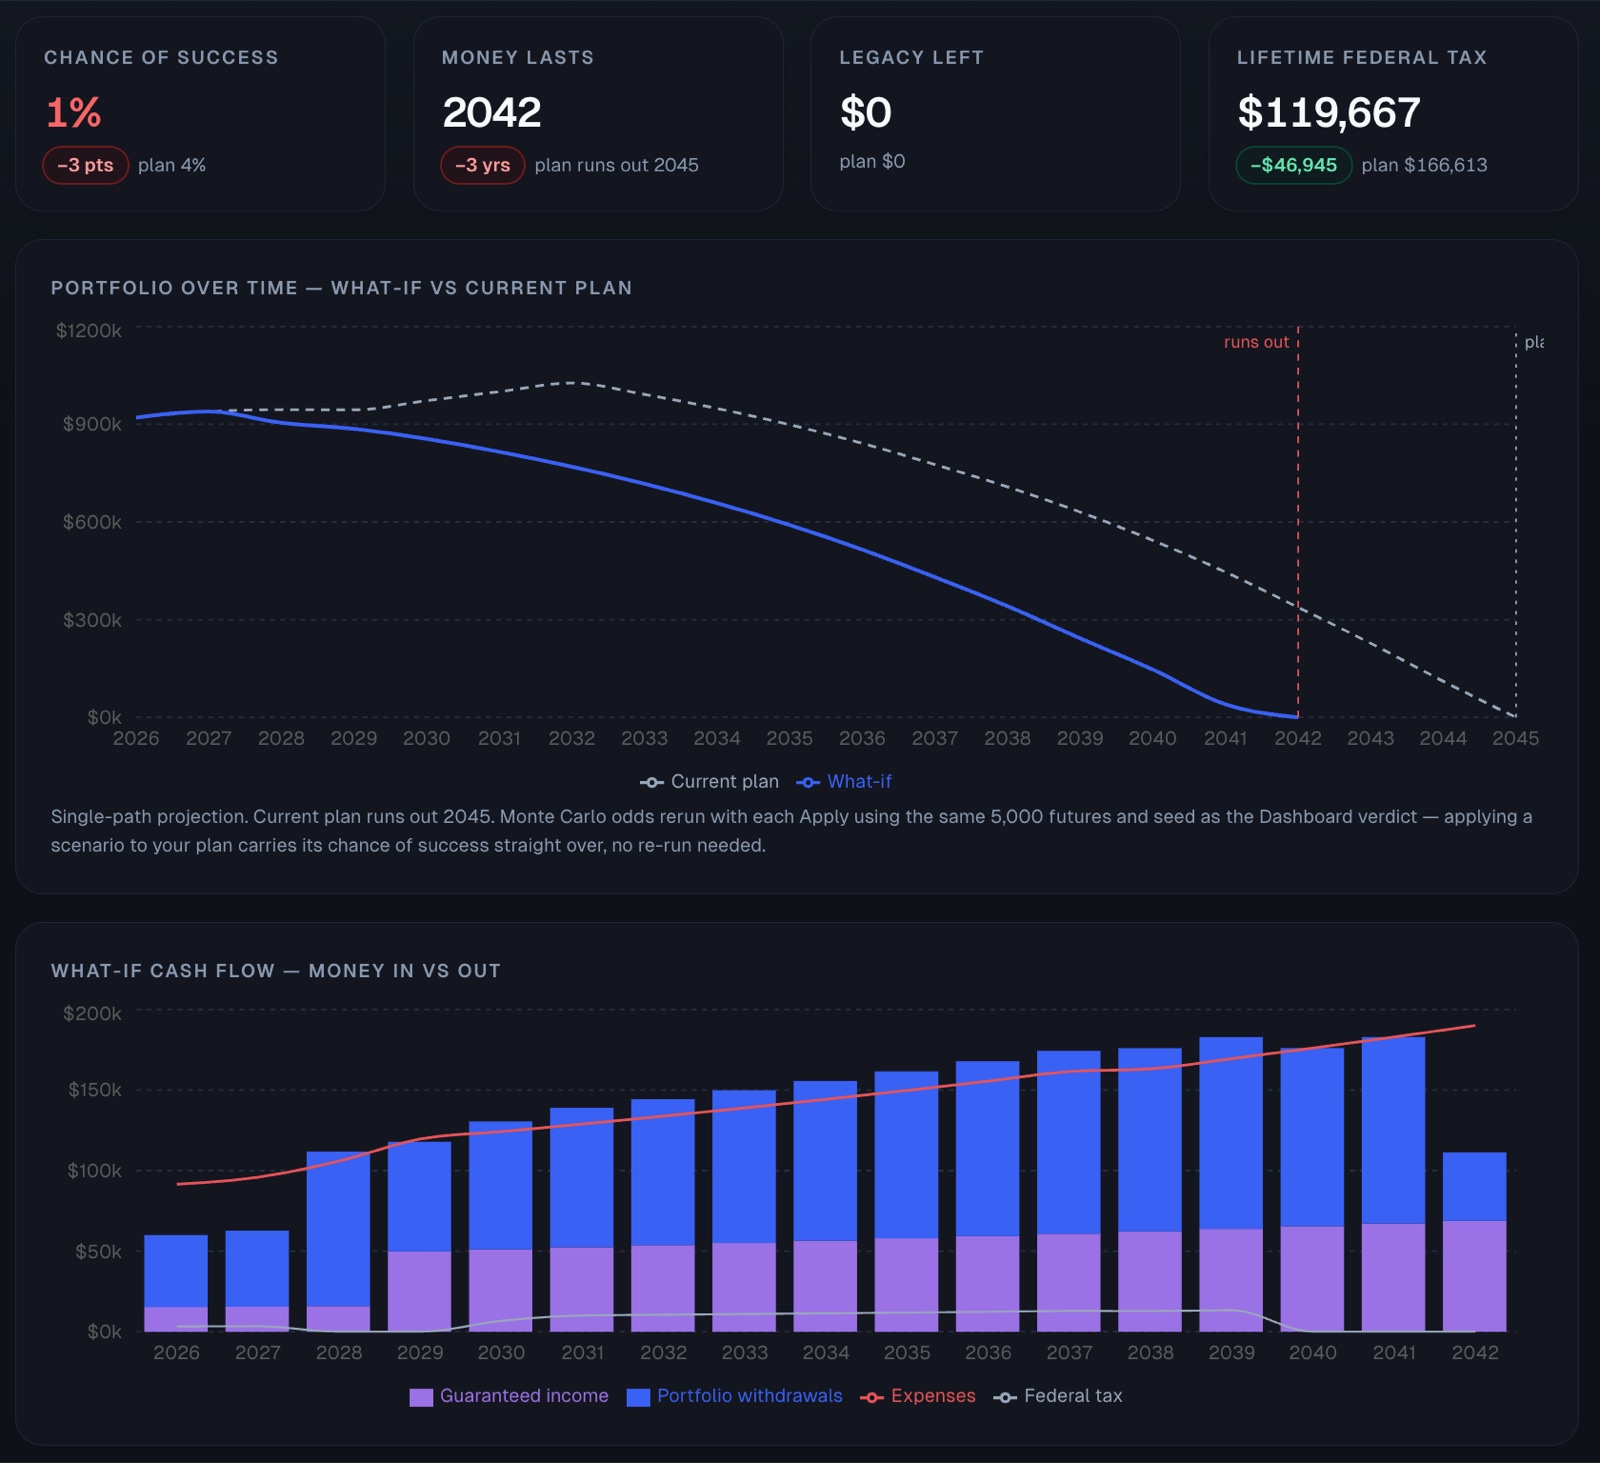
Each run re-runs the same engine and reports the difference against your saved plan: chance of success, the year the portfolio runs dry, legacy left, and lifetime federal tax. The portfolio chart plots the what-if against the current plan, and the cash-flow chart shows money in versus money out.
Know exactly what you changed
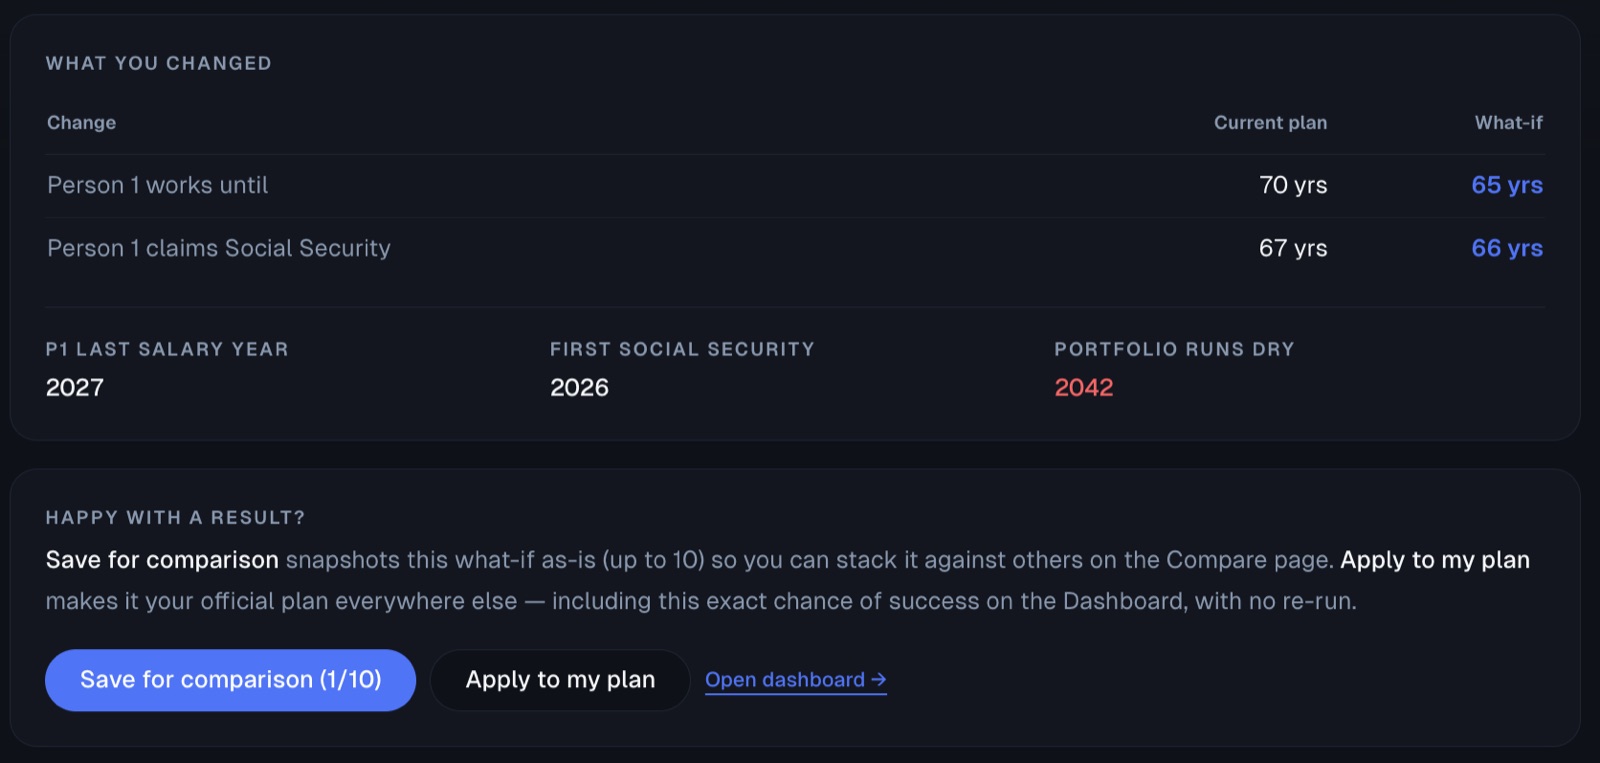
A running ledger of every change — current plan versus what-if — plus the milestone dates they move: last salary year, first Social Security year, and the year the portfolio runs dry. Then either save the scenario for comparison or apply it to your plan.
Pull the dials, one at a time
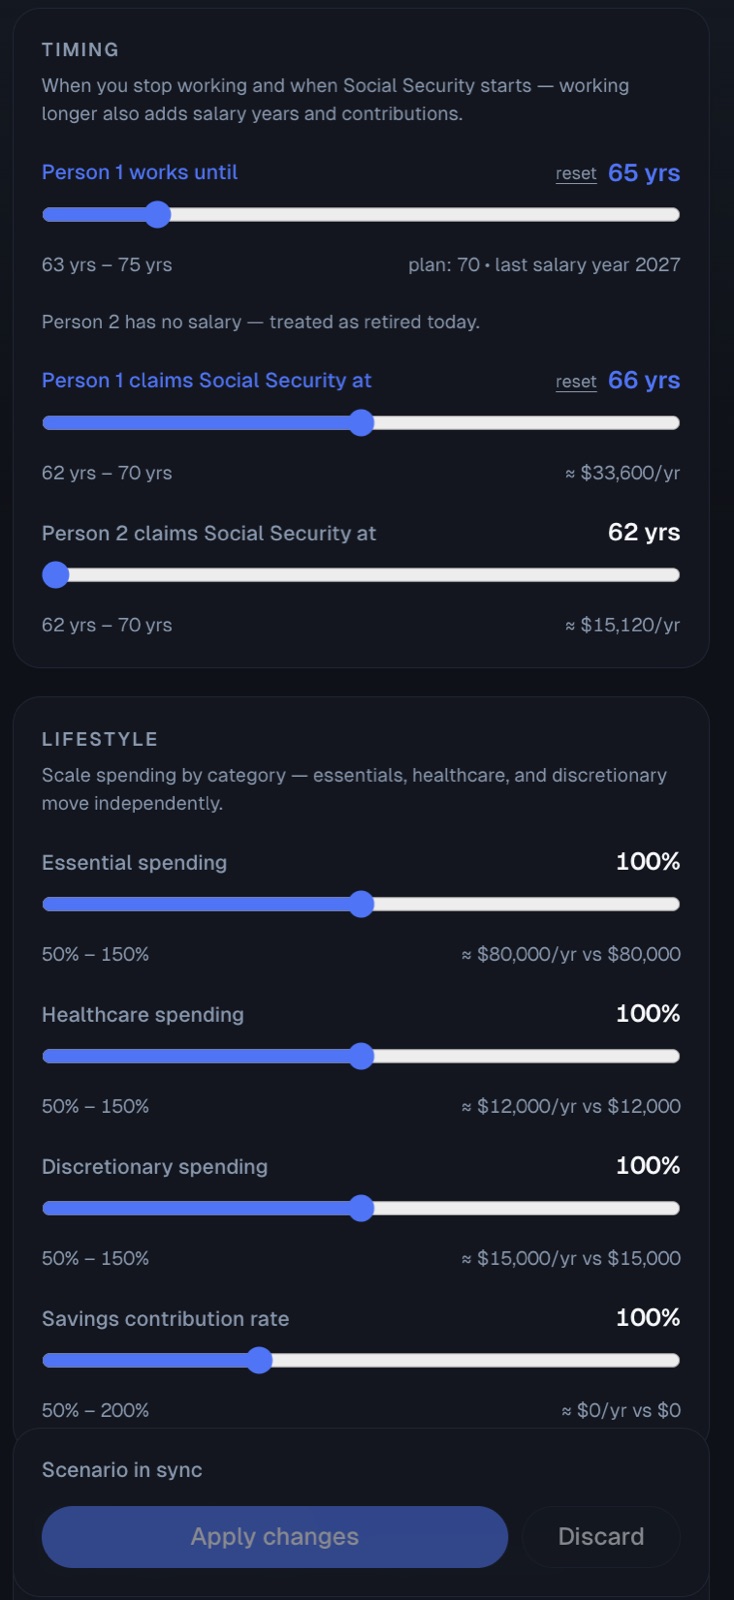
Timing covers when each person stops working and claims Social Security, since working longer also adds salary years and contributions. Lifestyle scales essentials, healthcare, and discretionary spending independently, along with the savings contribution rate.